

Arduino Air Quality Meter
- Emmanuel Odunlade
- https://twitter.com/emmaodunlade
- emmaodunlade@gmail.com
- 6.010 Views
- easy
- Tested
- 0 Likes

Recent campaigns around environment pollution helped increase the awareness around it with more people beginning to monitor their pollution footprint while also paying attention to the quality of air they breathe in. Different countries and communities have now several Air quality monitoring solutions deployed in strategic locations but there are times where you as an individual will have the desire for your own personal air quality monitoring solution to monitor the quality of air in your immediate vicinity. For today’s tutorial, we will look at how you can build a DIY personal air quality monitoring solution to monitor the quality of air around you.
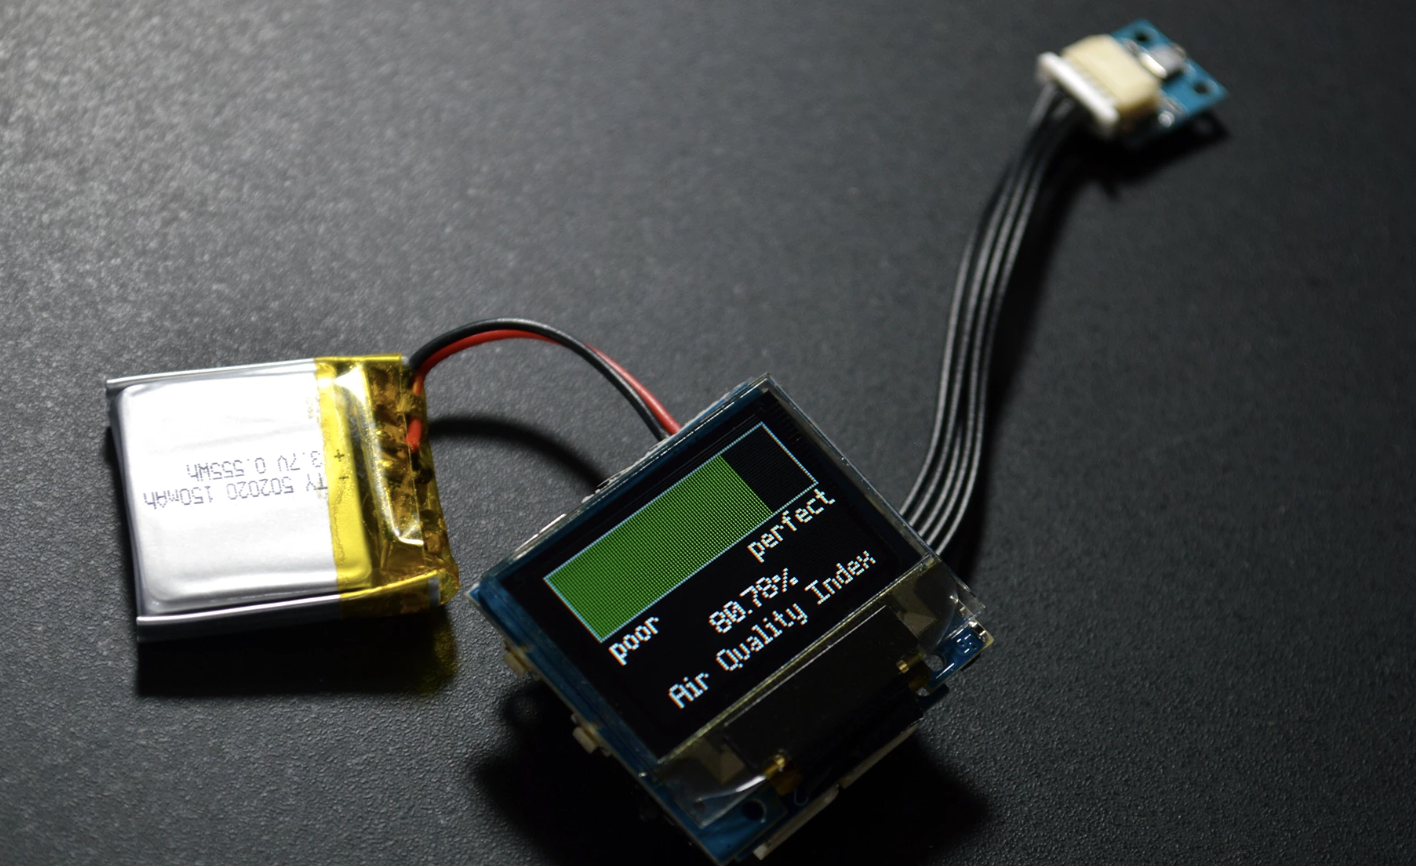
While there are several attempts at Air quality monitoring on the internet, today’s project will chronicle Zachary Lee‘s project because it provides a portable, battery-powered, intuitive solution. The project makes use of an air quality sensor from TinyCircuits called the VOC whisker along with a TinyScreen+ which is used to display the air quality index as a bar, and a LiPo battery to power the entire system.
The VOC Whisker is essentially a breakout board of the BME680 that allows you to monitor temperature, pressure, humidity, and Volatile Organic Compounds all at once. By its ability to measure VOC (Volatile Organic Compounds) levels, the VOC Whisker provides us with the required sensor to measure several carbon-based pollutants which when we are overexposed to, could lead to increased rates of allergies, respiratory disease, and various types of cancer.
Some of the most dangerous of the VOC’s that can be monitored with VOC whisker include:
- Benzene (commonly found in cigarettes, paint, and gasoline and is classified as a human carcinogen by the CDC)
- Formaldehyde (found in many glues, resins, foams, plywood, and cigarettes. It has been linked to brain cancer, leukemia and is one of the top 10 allergens)
- Styrene (Sweet smelling neurotoxin and carcinogen found in many plastics, with high concentration levels in styrofoam)
While the VOC whisker may not be able to measure the concentration level of each of the VOC’s in existence, it is able to measure the total quantity of VOC’s in the environment and give the index of the quality of air in that environment.
Asides it super small form factor and the incredible amount of parameters it can measure, some of the other features of whisker include;
- Digital interface I²C (up to 3.4 MHz) and SPI (3 and 4 wire, up to 10 MHz)
- Operating range -40 – +85°C, 0-100 % r.H., 300-1100 hPa
- Humidity, Pressure, Gas sensor can be independently enabled / disabled
- RoHS compliant, halogen-free, MS
- 3.0V – 5.5V Operating Voltage
- Low power (0.15 µA in sleep mode)
The VOC Whisker is also compatible with TinyCircuit’s TinyShield which makes it easy to connect it to other TinyCircuit products as it incorporates level shifting along with a local power supply to ensure proper and safe operation.
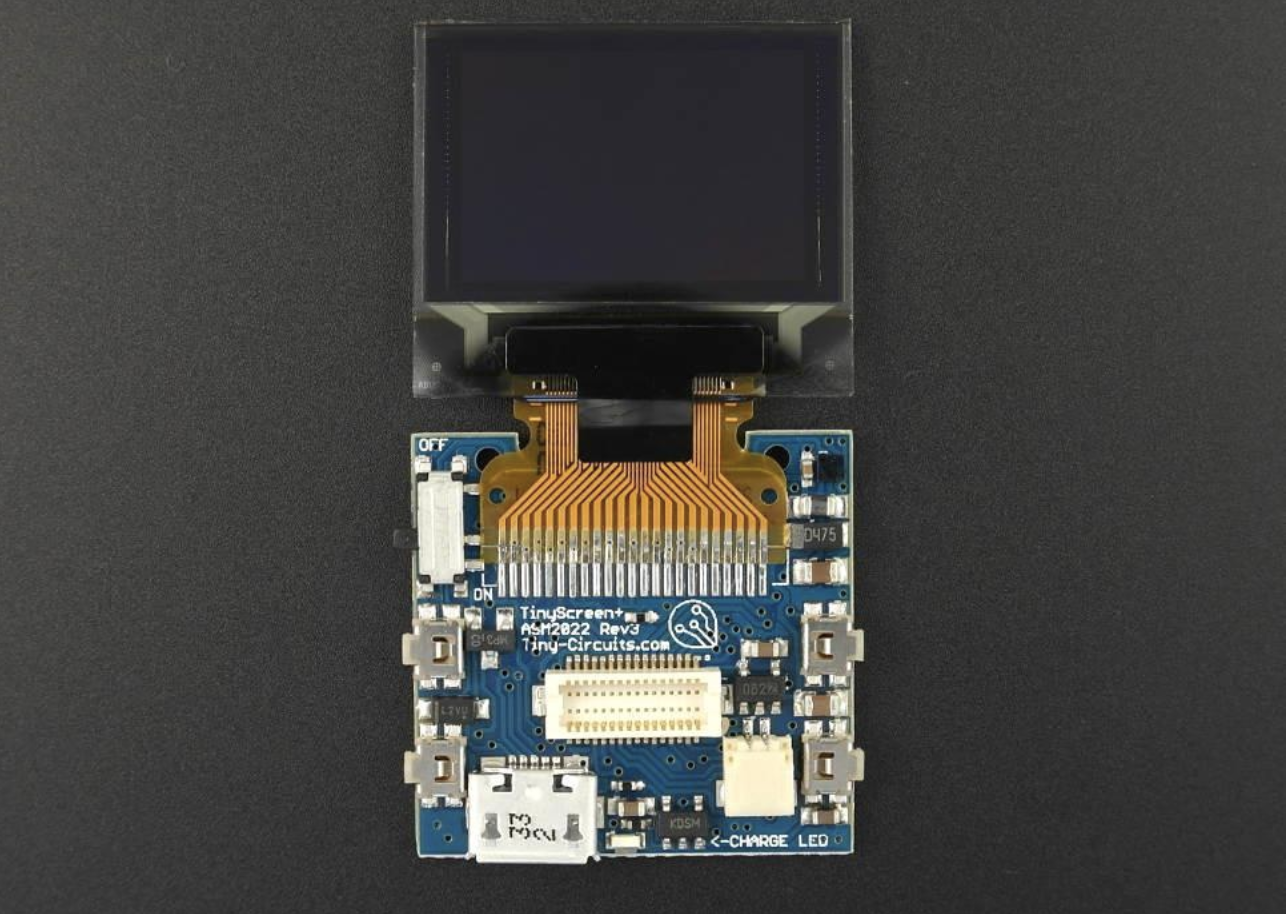
Another major component used in this project is the which doubles as the processor and the display. The TinyScreen+ is a combination of the TinyScreen shield from TinyCircuits (makers of TinyDuino), with an Atmel SAMD21 32-bit ARM processor (the same one used in the Arduino Zero), a USB port, power management IC/circuitry, and battery charger to get a super small, all-in-one, powerful OLED development platform. It retains the standard TinyShield expansion port which allows it for use of all of TinyCircuit’s current shields including whiskers and uses the same TinyScreen library inside the Arduino IDE with most TinyScreen examples working without with the TinyScreen+ without any modification.
At the end of today’s project, you would know not only how to build a personal air quality meter, but also the use of several awesome TinyCircuit components in your projects.
Required Component
The following components are required to build this project;
- TinyScreen+
- Temperature/Pressure/Humidity/VOC Whisker
- Whisker Adapter TinyShield
- 1x Whisker Cable
- MicroUSB Cable
- LiPo Battery
All of these components can be bought from TinyCircuits store or via the links attached to them.
Schematics
A good thing about TinyCircuit and the TinyShield is how most of the products are designed to snap into the shield, reducing the size of the project and eliminating the need to connect jumper wires from one place to the other.
Connect the Whisker Adapter TinyShield to the TinyScreen+ and connect the VOC Whisker to port 0 on the Whisker Adapter TinyShield via the Whisker cable such that the setup looks like the image above.
The battery should also be connected to it’s port on the TinyScreen+.
Preparing the Arduino IDE
If you have used products from TinyCircuits with the Arduino IDE in the past then you can skip this section but If this is the first time you will need to do some configuring of the Arduino IDE so it recognizes and is able to program the TinyScreen+ correctly. The configuration involves installing the TinyCircuits Core/Board support for the Arduino IDE. Follow the steps below to get this done.
1. Ensure you are running the latest official version of the Arduino IDE. You can download the latest version from their website.
2. Open the preferences window from the Arduino IDE. Go to File > Preferences
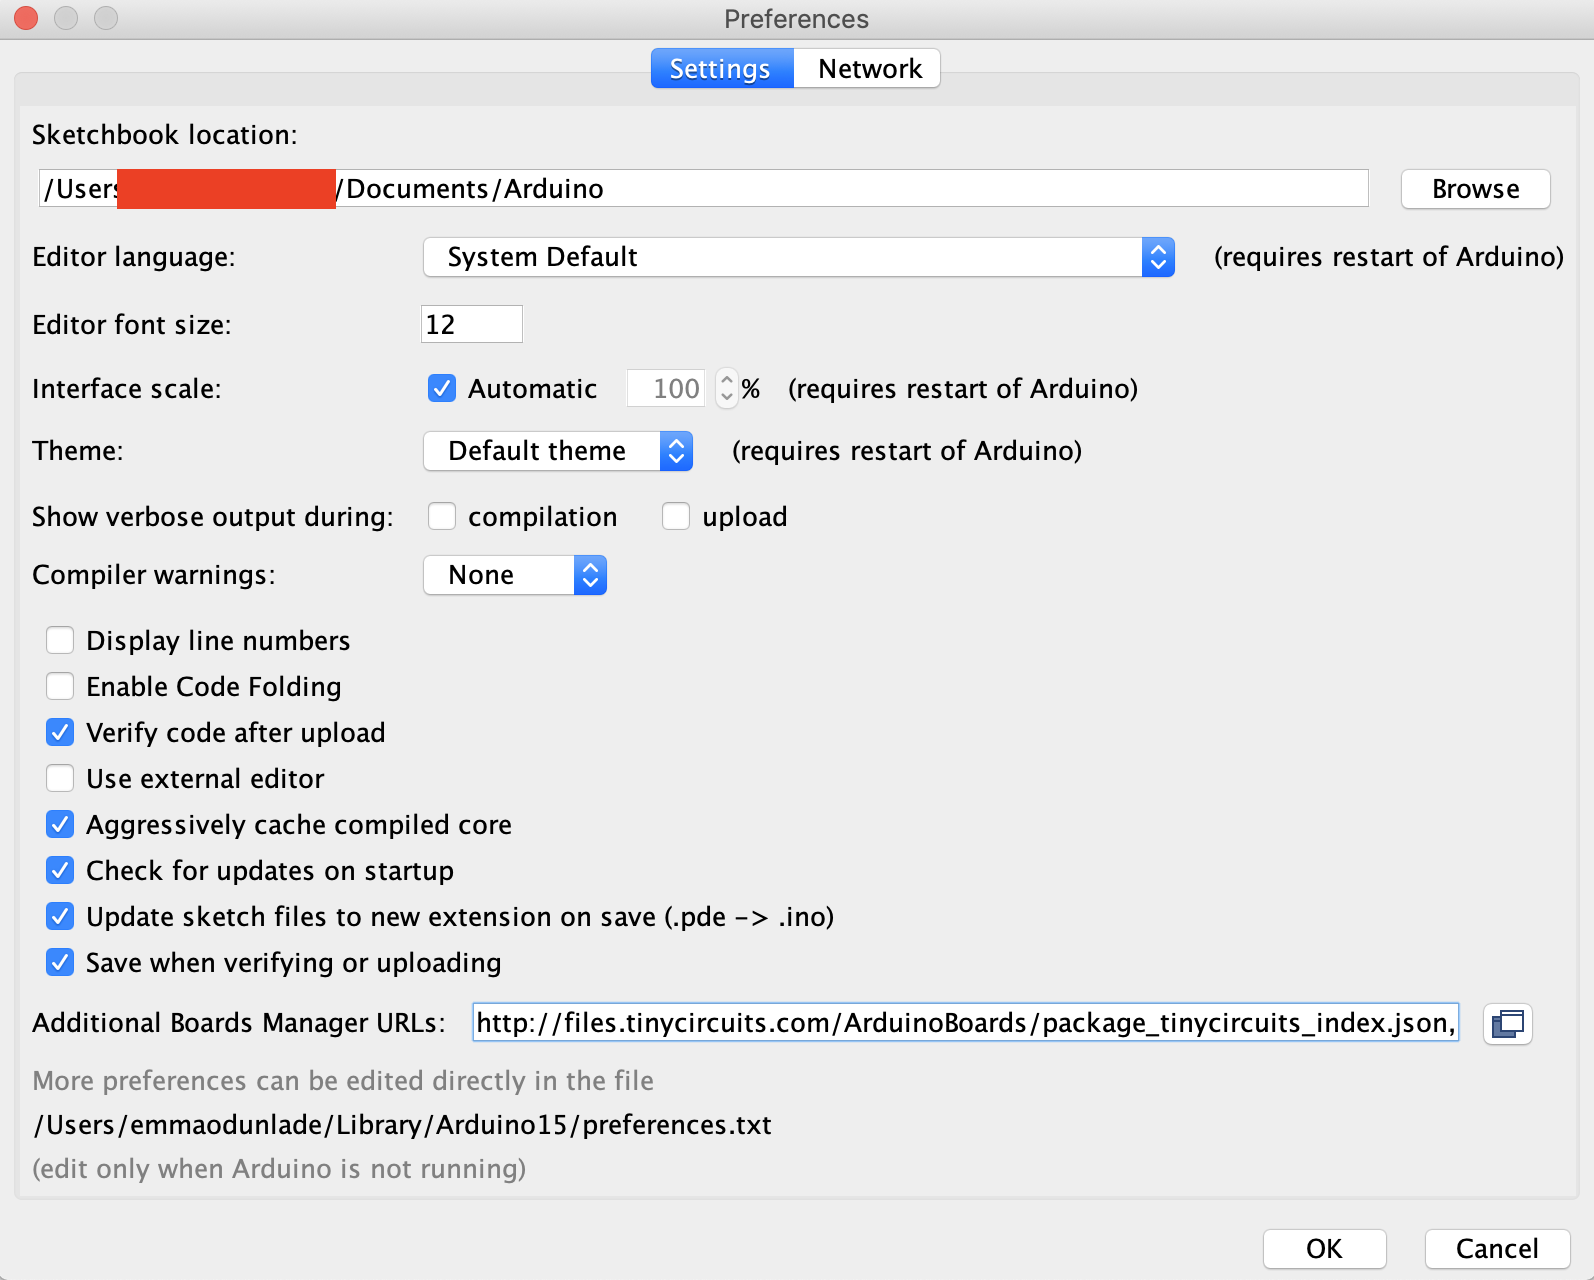
3. On the preferences window, locate the “Additional Board Manager URLs” text box and enter http://files.tinycircuits.com/ArduinoBoards/package_tinycircuits_index.json into the field as shown below. As you may have other URLs there already, separate the URLs from each other using a comma (“,”) and click OK when done.
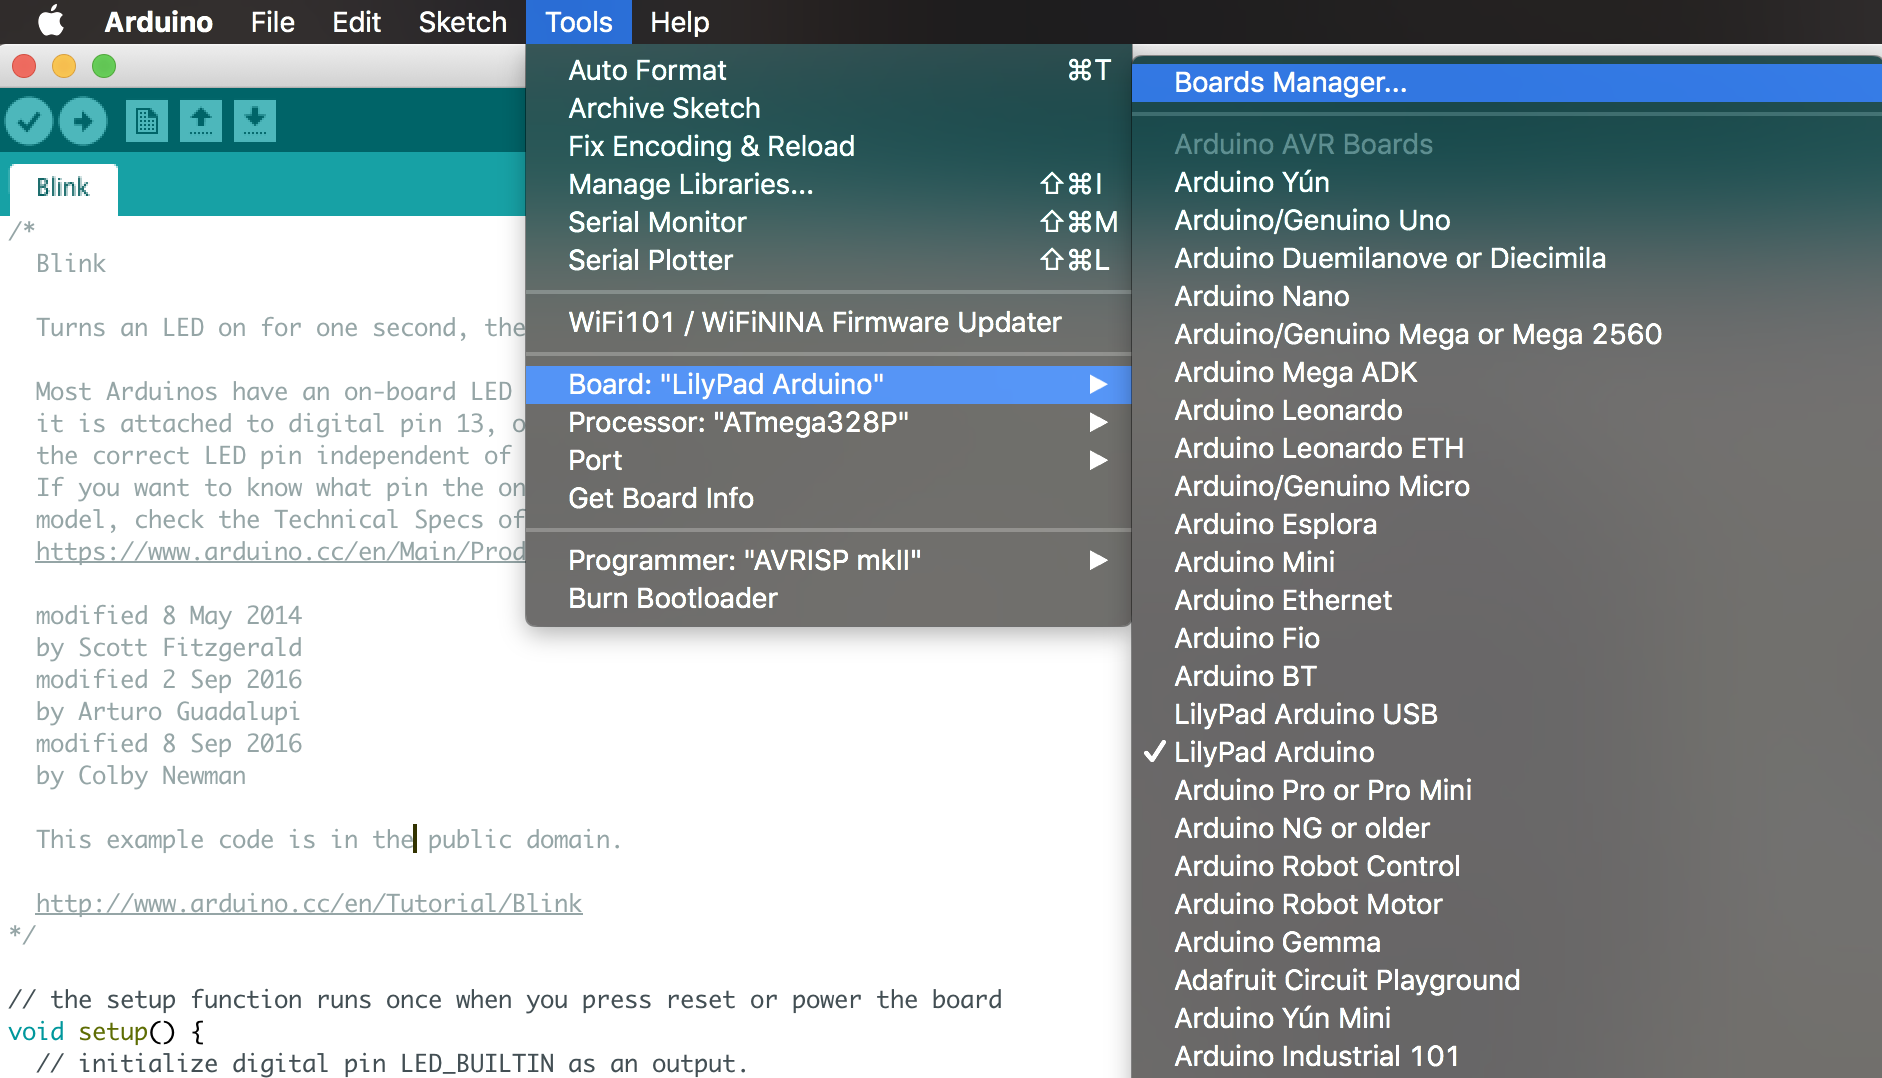
4. Next, open the Arduino board manager. Go to tools > Boards > Boards manager
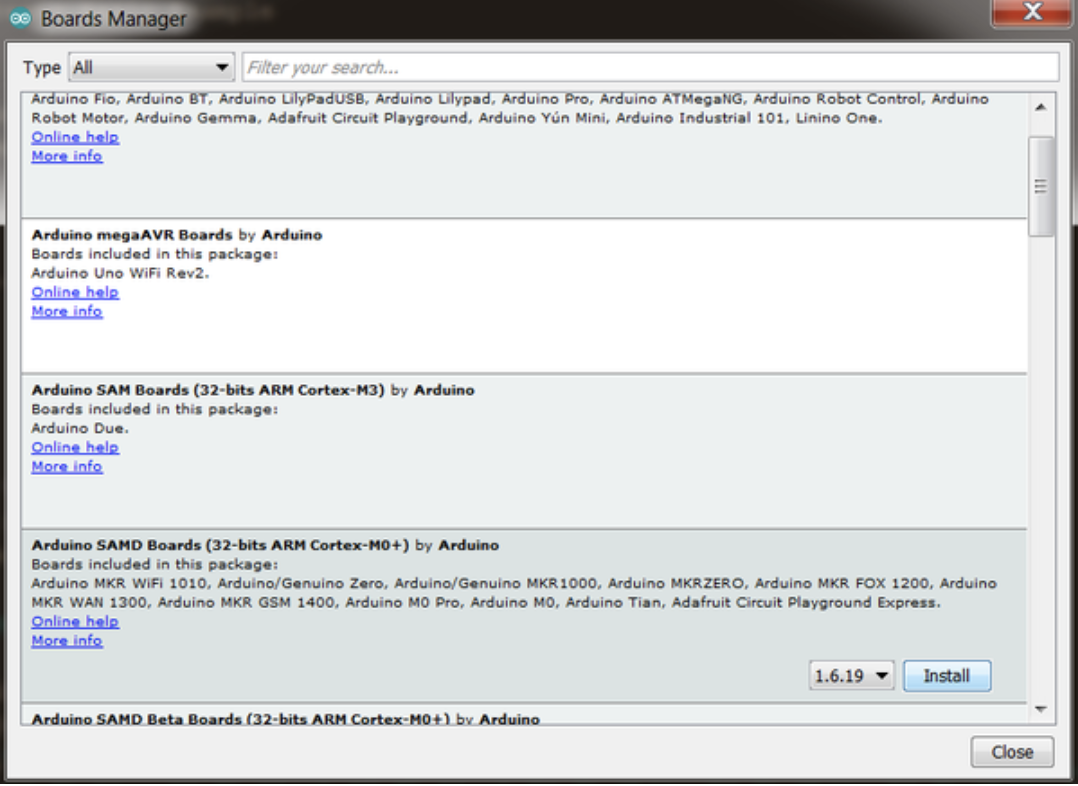
5. When the board manager opens, enter Arduino SAMD Boards into the search bar and scroll to the bottom, you will see “Arduino SAMD Boards (32-bits ARM Cortex-M0+) by Arduino”, select it and if not already installed and click on install.
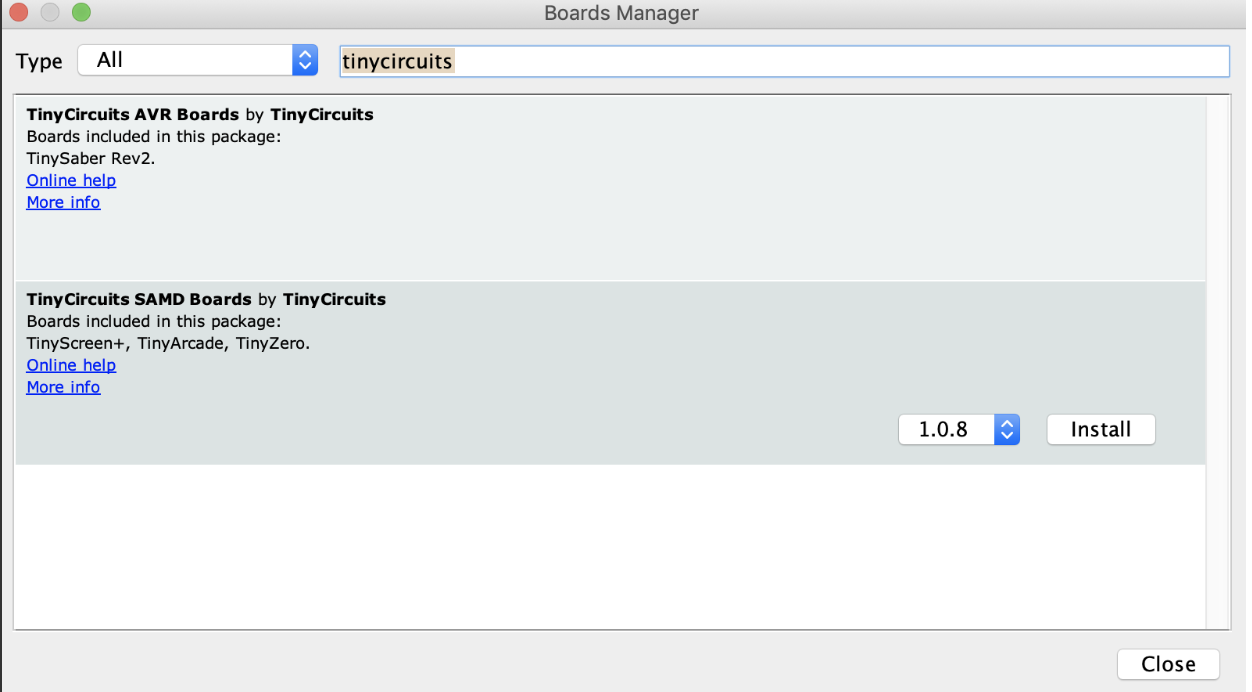
 6. In the same Board Manager window, enter TinyCircuits into the search bar and scroll down to select and install the TinyCircuits SAMD Boards.
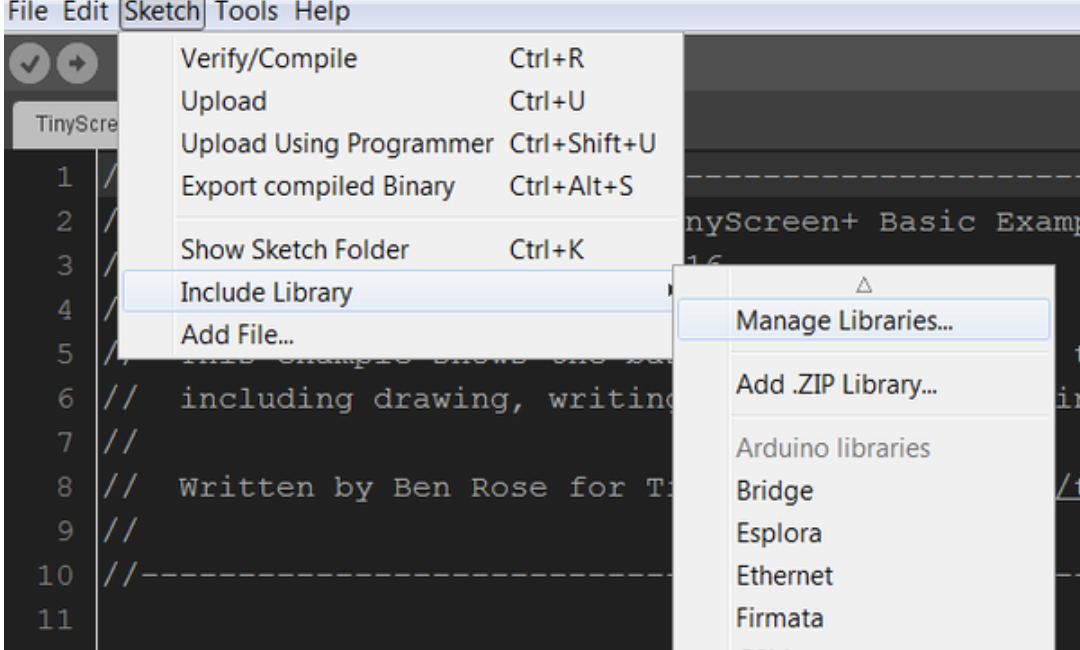
 7. With the above done, you should now have the TinyCircuit boards listed with the other boards on the IDE. Next, we need to install the TinyScreen Library. Go to Sketch->Include Library->Manage Libraries
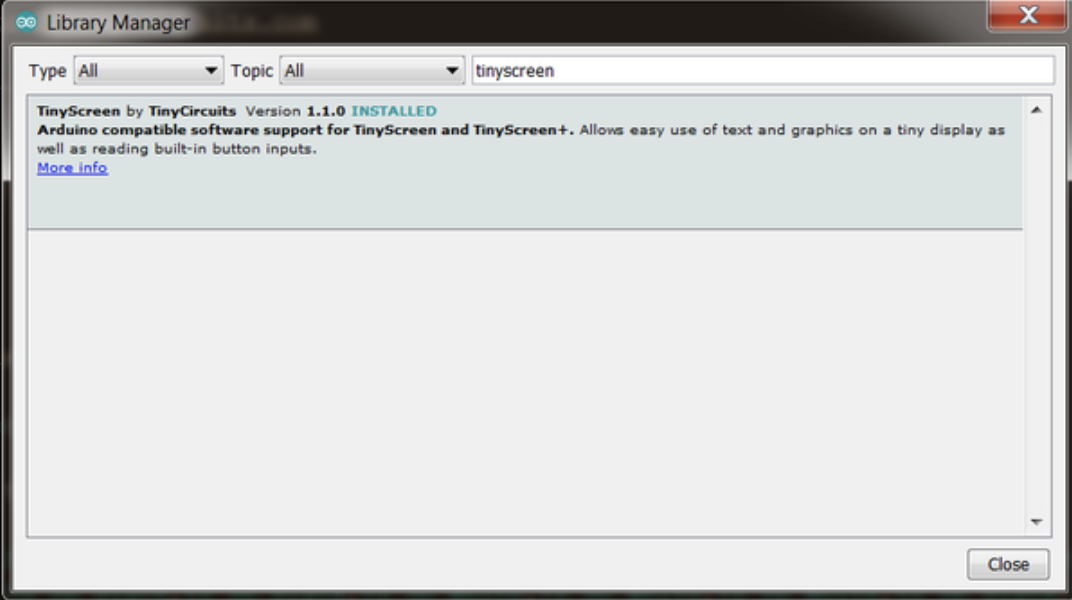
 8. Search for “TinyScreen”, select and install it.
 The TinyScreen library can also be installed manually by downloading it from the attached link and extracting its content into the Arduino libraries folder.
With these done, the Arduino IDE is now ready to be used in programming the TinyScreen+.
Code
The code for today’s project is quite straight forward. We will use the raw VOC readings from the BME680 to calculate and graph (using a progress bar) the Air Quality Index.
As already mentioned, the code will be developed using the Arduino IDE and in addition to the TinyScreen Library which we installed earlier, we will use a few other libraries to reduce the amount of work that needs to be done in developing the sketch for the project. Some of these libraries will include; the Adafruit BME680 library, the Adafruit Sensor Library, the TinyAnimation library, and the Arduino Wire library. The wire library facilitates communication with I2C devices and will be used to facilitate communication with the VOC Whisker, while the Adafruit BME280 and Adafruit_Sensor Library will be used to interface with the Whisker since the VOC whisker is based on the BME680. The TinyAnimation library is used along the TinyScreen library to create the progress bar and update the data on the display as its changes. All of these libraries can be installed via the Arduino Library Manager or via the link attached to them.
As usual, I will do a quick “run” through the code to explain some of the key concepts.
We start, as usual, by including all the libraries required for the sketch.
// This library is used for communication with I2C devices, such as the BME680 board
#include <Wire.h>

// This library is used to print sensor values to a TinyScreen
#include <TinyScreen.h>
#include "TinyAnimation.h"

// These libraries are used to interface with the BME680 Sensor
#include "Adafruit_Sensor.h"
#include "Adafruit_BME680.h"
Next, we create an instance of the BME680 library along with a variable to be used in determining the approximate altitude.
#define SEALEVELPRESSURE_HPA (1013.25) // used to find approximate altitude
Adafruit_BME680 bme; // I2C
Next, we create variables that are specific to the TinyScreen display, including an instance of the library, the background and variables to hold what the progress bar should look like for a certain range of values.
TinyScreen display = TinyScreen(TinyScreenPlus);
int background = TS_8b_Black; // sets the background color to black
PercentBarHorizontal terriblebar(display, 2, 2, 94, 28, TS_8b_Gray, TS_8b_DarkRed, TS_8b_White, 0, "poor", "perfect", true);
PercentBarHorizontal poorbar(display, 2, 2, 94, 28, TS_8b_Gray, TS_8b_Red, TS_8b_White, 0, "poor", "perfect", true);
PercentBarHorizontal averagebar(display, 2, 2, 94, 28, TS_8b_Gray, TS_8b_Yellow, TS_8b_White, 0, "poor", "perfect", true);
PercentBarHorizontal goodbar(display, 2, 2, 94, 28, TS_8b_Gray, TS_8b_Green, TS_8b_White, 0, "poor", "perfect", true);
PercentBarHorizontal excellentbar(display, 2, 2, 94, 28, TS_8b_Gray, TS_8b_DarkGreen, TS_8b_White, 0, "poor", "perfect", true);
Next, we create and initialize a few more variables that are important to the project including; a delayTime variable to specify the intervals between readings, a airQualityGraphic variable to let the user determine if the values are displayed graphically like with the progress bar or just dumped on the display without processing. Several other variables were created and initialized and they all have quite descriptive names so it should be easy to tell what if one stands for.
// Used to control how often sensor values are updated in the main loop()
unsigned long delayTime = 20;

// The power pin for our board, used for digitally writing to output
const int powerPin = 4;
const bool airQualityGraphic = true; // if set to true air quality graphic will be displayed instead of text output of all sensor data
const bool raw = false; // if set to true, raw VOC data will be displayed instead of an airQuality percentage based on that data
const bool displayAlt = false; // if set to true, altitude will be displayed on the TinyScreen+ instead of air quality/raw due to shortage of room. Will not impact serial output.
float airQuality = 0.00;
float allTimeHighest = 0.00;
float highestInRange = 0.00;
float secondHighestInRange = 0.00;
unsigned long highRangeTime = millis();
unsigned long secondRangeTime = millis();
const int MAX = 550000; // theoretical max raw air quality reading. used for a small percentage of the air quality calculation
const int RANGE_DURATION = 18; // 50% of the VOC portion of the air quality reading will be based on the difference between the current value and the extremes of the last RANGE_DURATION hours
Next, we write the void setup() function.
We start the function by initializing serial communication (with SerialUSB being the TinyCircuit library version of the “Serial” identifier in Arduino) so we can use the serial monitor for debugging.
void setup() {
SerialUSB.begin(9600); // Bandwidth for our communication
Next, we set the pinMode of the power pin of the sensor after which we initialize I2C wire communication, and set the port of the TinyScreen to which the VOC Whisker is connected.
// We want to see Digital Output from the sensor
  pinMode(powerPin, OUTPUT);
  digitalWrite(powerPin, HIGH);

  Wire.begin();
  selectPort(0); // The adapter board has 4 different ports (0-3),
  // make sure your software matches the setup!
Next, we initialize the display; setting its brightness level, font, and text color.
// This is the setup used to initialize the TinyScreen's appearance
  display.begin();
  display.setBrightness(15);
  display.setFlip(true);
  display.setFont(thinPixel7_10ptFontInfo);
  display.fontColor(TS_8b_White, background);
We set the cursor to a coordinate at the middle of the display and print a welcome message.
// Set the cursor to the following coordinates before it prints "BME680 Test"
  display.setCursor(7, 54);
  display.print("Air Quality Index");
Next, we check the status of the BME680 t0 see if it is properly connected. If it is, the system proceeds to set up oversampling and initialize filters for each of the parameters to be monitored but if it’s not, the processor is halted using a while(1) loop.
// If the bme sensor is not found, throw statement and stop program
  // If you end up here, check to make sure your value in selectPort() is correct!
  if (!bme.begin(0x76)) {
    display.setCursor(12, 12);
    display.print("No Sensor!");  // Printed to TinyScreen
    SerialUSB.println("Could not find a valid BME680 sensor, check wiring!"); // Printed to Serial Monitor
    while (1); // loop forever, because the rest of the program means nothing without the sensor
  }
  // Set up oversampling and filter initialization
  bme.setTemperatureOversampling(BME680_OS_8X);
  bme.setHumidityOversampling(BME680_OS_2X);
  bme.setPressureOversampling(BME680_OS_4X);
  bme.setIIRFilterSize(BME680_FILTER_SIZE_3);
  bme.setGasHeater(320, 150); // 320*C for 150 ms

  terriblebar.updateBarEndInfo(); // Apply the letters to the screen once so we don't have to every tick
}
Next, we write the void loop() function.
We start the function by reading the BME680 and based on the readings obtained, we compare and calculate the Air Quality value.
void loop() {
  if (! bme.performReading()) {
    SerialUSB.println("Failed to perform reading :(");
    return;
  }
  validateRange();
  compareAirQuality();
  calculateQuality();
The value is then converted into a percentage and categorized, based on the percentage, into terrible, poor, average, good, or excellent, with excellent being a percentage between 80 – 100 and terrible being anything below 20. Based on the category the reading falls into, the right progress bar and the value is displayed on the on the TinyScreen+.
  airQuality /= 100;
  if(airQuality*100 < 20) // terrible
  {
     terriblebar.tick(airQuality);
  }
  else if(airQuality*100 < 40 && airQuality*100 >=20) // poor
  {
     poorbar.tick(airQuality);
  }
  else if(airQuality*100 < 60 && airQuality*100 >=40) // average
  {
     averagebar.tick(airQuality);
  }
 else if(airQuality*100 < 80 && airQuality*100 >=60) // good
  {
     goodbar.tick(airQuality);
  }
 else //(airQuality*100 >=80) excellent
  {
     excellentbar.tick(airQuality);
  }
  airQuality *= 100;
  delay(delayTime); // How often values are updated and printed
}
The remaining part of the sketch are the functions that were called within the setup and loop() functions including; the validateRange() function, CalculateQuality(), compareAirQuality(), and selectPort(). The code for these functions contain variables with very descriptive names and it should be easy to follow to understand what each one does.
// **This function is necessary for all Whisker boards attached through an Adapter board**
// Selects the correct address of the port being used in the Adapter board
void selectPort(int port) {
  Wire.beginTransmission(0x70); //I2C
  Wire.write(0x04 + port);
  Wire.endTransmission();
}

void compareAirQuality()
{
  float temp = (bme.gas_resistance/1000);
  if(temp>allTimeHighest)
  {
    allTimeHighest = temp;
  }
   if(temp>highestInRange)
  {
    secondHighestInRange = highestInRange;
    secondRangeTime = highRangeTime;
    highestInRange = temp;
    highRangeTime = millis();
  }
}

void validateRange()
{
  if(((((millis()-highRangeTime)/1000)/60)/60)>RANGE_DURATION)
  {
    highestInRange = secondHighestInRange;
  }
  if(((((millis()-secondRangeTime)/1000)/60)/60)>RANGE_DURATION)
  {
    secondHighestInRange = bme.gas_resistance/1000;
  }
}

void calculateQuality()
{
  float raw = (bme.gas_resistance/1000);
  float rawHumidity = bme.readHumidity();
  float shortTermQuality = 1-((highestInRange-raw)/highestInRange);
  float longTermQuality = 1-((allTimeHighest-raw)/allTimeHighest);
  float theoreticalQuality = 1-((MAX-raw)/MAX);
  float humidityIndex = 1-(abs(rawHumidity-40.00)/100); // absolute difference between current humidity and optimal humidity
  airQuality = (0.75*((shortTermQuality*0.5)+(longTermQuality*0.25)+(theoreticalQuality*0.25))+(humidityIndex*0.25))*100.00;
  SerialUSB.print("airQuality: ");
  SerialUSB.print(airQuality);
  SerialUSB.println("%");
}
The complete code for the project is provided below and also attached (along with all the libraries used) in the zip file under the download section.
/*************************************************************************
   BME680 Air Quality Index Example:

   Calculates and graphs an Air Quality Index (AQI) based on the
   raw VOC readings of the BME680. Note that the air quality metric
   becomes slightly more accurate the longer the sketch is run
   without interruption. This is because 40% of the calculation is
   based on the ratio between current raw air quality and the
   extreme levels of air quality in the past 18 hours.

   Hardware by: TinyCircuits
   BME680 Library by: Adafruit
   Code by: Zachary Lee for TinyCircuits

   Initiated: Mon. 08/05/19
 ************************************************************************/

// This library is used for communication with I2C devices, such as the BME680 board
#include <Wire.h>

// This library is used to print sensor values to a TinyScreen
#include <TinyScreen.h>
#include "TinyAnimation.h"

// These libraries are used to interface with the BME680 Sensor
#include "Adafruit_Sensor.h"
#include "Adafruit_BME680.h"

// Global Sensor Variables
#define SEALEVELPRESSURE_HPA (1013.25) // used to find approximate altitude
Adafruit_BME680 bme; // I2C

// TinyScreen Global Variables
TinyScreen display = TinyScreen(TinyScreenPlus);
int background = TS_8b_Black; // sets the background color to black
PercentBarHorizontal terriblebar(display, 2, 2, 94, 28, TS_8b_Gray, TS_8b_DarkRed, TS_8b_White, 0, "poor", "perfect", true);
PercentBarHorizontal poorbar(display, 2, 2, 94, 28, TS_8b_Gray, TS_8b_Red, TS_8b_White, 0, "poor", "perfect", true);
PercentBarHorizontal averagebar(display, 2, 2, 94, 28, TS_8b_Gray, TS_8b_Yellow, TS_8b_White, 0, "poor", "perfect", true);
PercentBarHorizontal goodbar(display, 2, 2, 94, 28, TS_8b_Gray, TS_8b_Green, TS_8b_White, 0, "poor", "perfect", true);
PercentBarHorizontal excellentbar(display, 2, 2, 94, 28, TS_8b_Gray, TS_8b_DarkGreen, TS_8b_White, 0, "poor", "perfect", true);

// Used to control how often sensor values are updated in the main loop()
unsigned long delayTime = 20;

// The power pin for our board, used for digitally writing to output
const int powerPin = 4;
const bool airQualityGraphic = true; // if set to true air quality graphic will be displayed instead of text output of all sensor data
const bool raw = false; // if set to true, raw VOC data will be displayed instead of an airQuality percentage based on that data
const bool displayAlt = false; // if set to true, altitude will be displayed on the TinyScreen+ instead of air quality/raw due to shortage of room. Will not impact serial output.
float airQuality = 0.00;
float allTimeHighest = 0.00;
float highestInRange = 0.00;
float secondHighestInRange = 0.00;
unsigned long highRangeTime = millis();
unsigned long secondRangeTime = millis();
const int MAX = 550000; // theoretical max raw air quality reading. used for a small percentage of the air quality calculation
const int RANGE_DURATION = 18; // 50% of the VOC portion of the air quality reading will be based on the difference between the current value and the extremes of the last RANGE_DURATION hours

void setup() {
  SerialUSB.begin(9600); // Bandwidth for our communication
  // Print to Serial Monitor
  // You can pass flash-memory based strings to SerialUSB.print() by wrapping them with F().
  // This means you're using flash memory instead of RAM to print stuff
//  while (!SerialUSB);
  SerialUSB.println(F("BME680 test"));

  // We want to see Digital Output from the sensor
  pinMode(powerPin, OUTPUT);
  digitalWrite(powerPin, HIGH);

  Wire.begin();
  selectPort(0); // The adapter board has 4 different ports (0-3),
  // make sure your software matches the setup!

  // This is the setup used to initialize the TinyScreen's appearance
  display.begin();
  display.setBrightness(15);
  display.setFlip(true);
  display.setFont(thinPixel7_10ptFontInfo);
  display.fontColor(TS_8b_White, background);

  // Set the cursor to the following coordinates before it prints "BME680 Test"
  display.setCursor(7, 54);
  display.print("Air Quality Index");

  // If the bme sensor is not found, throw statement and stop program
  // If you end up here, check to make sure your value in selectPort() is correct!
  if (!bme.begin(0x76)) {
    display.setCursor(12, 12);
    display.print("No Sensor!");  // Printed to TinyScreen
    SerialUSB.println("Could not find a valid BME680 sensor, check wiring!"); // Printed to Serial Monitor
    while (1); // loop forever, because the rest of the program means nothing without the sensor
  }
  // Set up oversampling and filter initialization
  bme.setTemperatureOversampling(BME680_OS_8X);
  bme.setHumidityOversampling(BME680_OS_2X);
  bme.setPressureOversampling(BME680_OS_4X);
  bme.setIIRFilterSize(BME680_FILTER_SIZE_3);
  bme.setGasHeater(320, 150); // 320*C for 150 ms

  terriblebar.updateBarEndInfo(); // Apply the letters to the screen once so we don't have to every tick
}

// Forever looping the following logic
void loop() {
  if (! bme.performReading()) {
    SerialUSB.println("Failed to perform reading :(");
    return;
  }
  validateRange();
  compareAirQuality();
  calculateQuality();

  airQuality /= 100;
  if(airQuality*100 < 20) // terrible
  {
     terriblebar.tick(airQuality);
  }
  else if(airQuality*100 < 40 && airQuality*100 >=20) // poor
  {
     poorbar.tick(airQuality);
  }
  else if(airQuality*100 < 60 && airQuality*100 >=40) // average
  {
     averagebar.tick(airQuality);
  }
 else if(airQuality*100 < 80 && airQuality*100 >=60) // good
  {
     goodbar.tick(airQuality);
  }
 else //(airQuality*100 >=80) excellent
  {
     excellentbar.tick(airQuality);
  }
  airQuality *= 100;
  delay(delayTime); // How often values are updated and printed
}

// **This function is necessary for all Whisker boards attached through an Adapter board**
// Selects the correct address of the port being used in the Adapter board
void selectPort(int port) {
  Wire.beginTransmission(0x70); //I2C
  Wire.write(0x04 + port);
  Wire.endTransmission();
}

void compareAirQuality()
{
  float temp = (bme.gas_resistance/1000);
  if(temp>allTimeHighest)
  {
    allTimeHighest = temp;
  }
   if(temp>highestInRange)
  {
    secondHighestInRange = highestInRange;
    secondRangeTime = highRangeTime;
    highestInRange = temp;
    highRangeTime = millis();
  }
}

void validateRange()
{
  if(((((millis()-highRangeTime)/1000)/60)/60)>RANGE_DURATION)
  {
    highestInRange = secondHighestInRange;
  }
  if(((((millis()-secondRangeTime)/1000)/60)/60)>RANGE_DURATION)
  {
    secondHighestInRange = bme.gas_resistance/1000;
  }
}

void calculateQuality()
{
  float raw = (bme.gas_resistance/1000);
  float rawHumidity = bme.readHumidity();
  float shortTermQuality = 1-((highestInRange-raw)/highestInRange);
  float longTermQuality = 1-((allTimeHighest-raw)/allTimeHighest);
  float theoreticalQuality = 1-((MAX-raw)/MAX);
  float humidityIndex = 1-(abs(rawHumidity-40.00)/100); // absolute difference between current humidity and optimal humidity
  airQuality = (0.75*((shortTermQuality*0.5)+(longTermQuality*0.25)+(theoreticalQuality*0.25))+(humidityIndex*0.25))*100.00;
  SerialUSB.print("airQuality: ");
  SerialUSB.print(airQuality);
  SerialUSB.println("%");
}
Uploading the Code
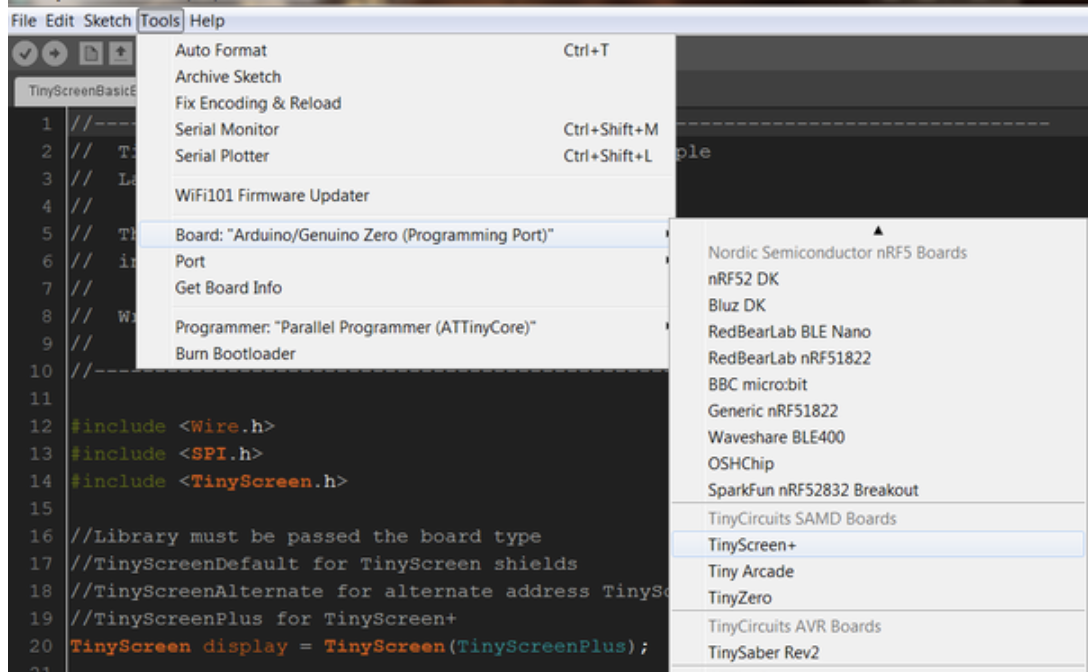
Go over your connections once again to ensure everything is as it should be. Verify the code and when done, connect the TinyScreen+ to your computer. Go to tools -> Boards and select TinyScreen+ as shown in the image below.
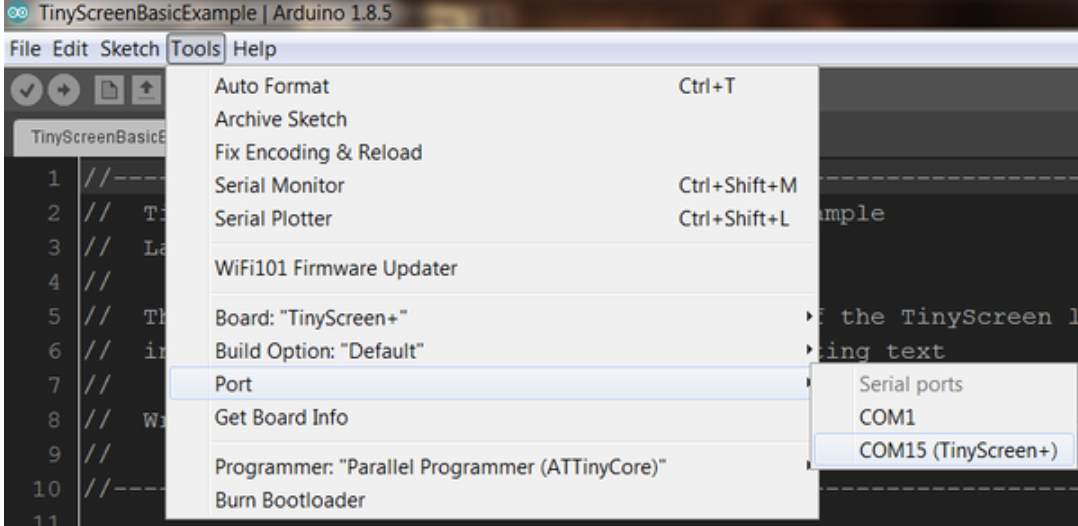
 Select the Port to which the tinyScreen+ is connected and hit the upload button.
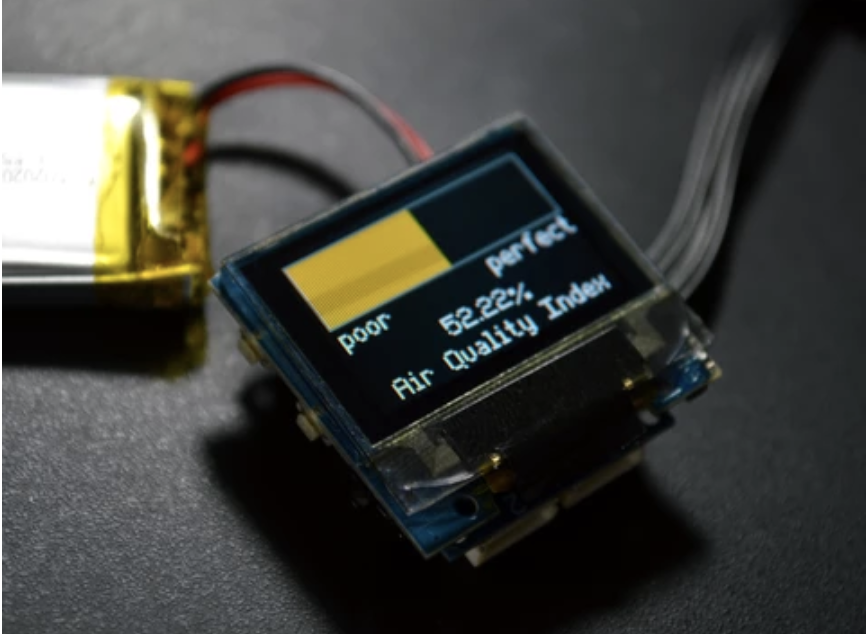
Demo
After the Sketch upload is complete you should see the device display the quality of air around it. To test it, you can move into a construction site or an open field for instance and examine the difference between the Air Quality index for both environments. An air quality value very close to the poor mark means it’s best if the user vacates that vicinity, while a value closer to the perfect mark means that location/environment is one of the “best place to be” on earth.
That’s it for this tutorial and thanks for reading. As usual, feel free to reach out to me via the comment section if you have any difficulties replicating this.


 EMI Filter – 480VAC")
“The VOC Whisker is essentially an upgraded version of the BME680 that allows you monitor temperature, pressure, humidity and Volatile Organic Compounds all at once”. This made no sense to me because those parameters are exactly what the BME680 can sense. Looking at the so-called VOC Whisker, which is merely a breakout for the BME680, I noticed that they call it an upgrade from the BME280 (not the 680), which is kind of true, since the VOC sensing is what separates the 280 and the 680, along with a slightly bigger package.
Thanks for your input. We fixed that mention.
Hello Mike
This is a very project I will like to replicate as I live around the coast that necessitates these parameters.
Could you kindly contact me via esk.gyimah@gmail.com
WhatsApp:+233241782407
Kind regards