

Using the Arduino IDE’s Serial Plotter Feature
- Nick Koumaris
- http://educ8s.tv
- info@educ8s.tv
- 20.104 Views
- moderate
- Tested
- 0 Likes

Visualizing data when working with the Arduino is something we all have had to do using third party/ self-developed software in the past. It was thus, it is really interesting when the Arduino team decided to change that recently. Today, we are going to take a look at their solution, called, the Serial Plotter, a new tool that comes with the latest version of the Arduino IDE.
The serial plotter provides a medium through which we can see a plot of the data being printed to the Arduino’s serial port in real time. Before the inclusion of this feature in the Arduino IDE, developers/makers usually have to write additional code using other tools and programming languages like Python or more popularly Processing to get a plot of the Arduino’s Data. This at times makes debugging difficult due to the extra work and time it requires especially in waveform based applications where viewing the data on the serial monitor will not be sufficient.
The serial plotter basically takes values coming from the preset serial port and plots them on a x-y axis graph. The Y-axis represents the values from the serial port and automatically adjusts itself as the value increases or decrease. The X-axis can be said to represent an instance of time. Each point on the x-axis represents the execution of a println statement within the Arduino code. In plainer terms, each time a println command is executed, a new point/data (value of Y corresponding to that particular println statement) is recorded on the graph. The limitation of the serial plotter in this version of Arduino IDE is the fact that it only supports a total of 500 data samples, after which the plotter may need to be restarted. This may make the plotter, unsuitable for certain applications, but I believe this will change with upcoming versions of the IDE.
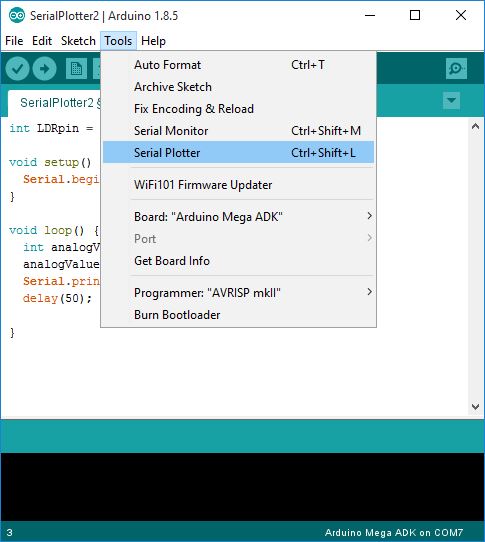
The serial plotter can be invoked after uploading code to the Arduino board, by clicking on tools -> serial plotter from the drop-down menu or by pressing CTRL + SHIFT + L which is the keyboard shortcut for the same.
To demonstrate the use of serial plotter in today’s tutorial, we will build two examples.
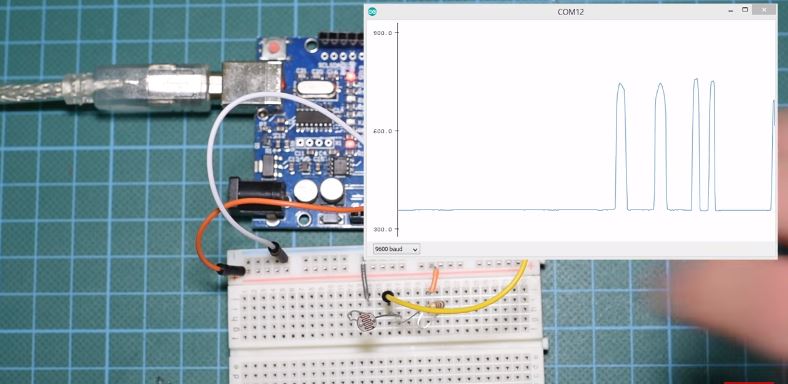
For the first example, we will use the Serial Plotter to plot the data from a photoresistor. This will give us the ability to examine how the data changes with the luminous intensity without trying to make sense of the numbers being printed over the serial monitor.
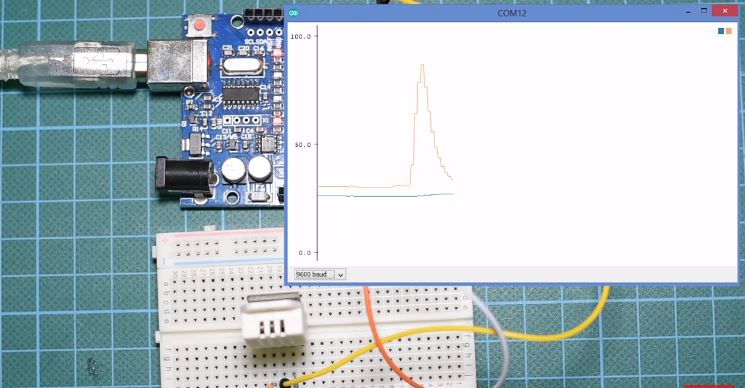
For the second example, we will be using a DHT22 temperature and humidity sensor. The goal of this example will be to show how to plot the data from multiple sensors using the Arduino serial plotter.
Required Components
The following components are required to build the two examples for this tutorial:
These components, as usual, can be purchased via the links attached to each of them.
Schematics
If you have been a follower of our tutorial series on this website, you should be very familiar with the schematics for this project. For simplicity, we will use one schematic for each example.
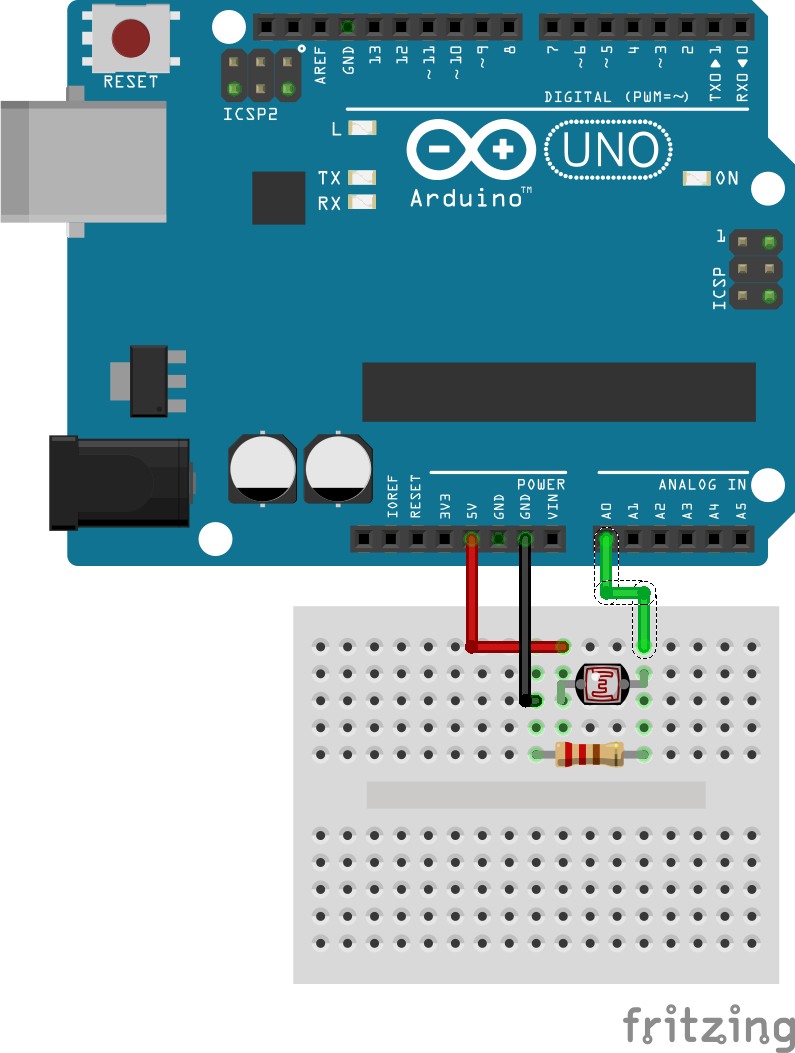
For the first example which involves plotting of photoresistor’s data, the circuit is essentially a voltage divider connected to an analog pin on the Arduino. The divider is made up of the photoresistor on one part and an ordinary resistor on the other part. Connect the components as shown in the schematics below.
For the second example, the circuit comprises of the DHT22 temperature and humidity sensor connected to the Arduino as shown in the schematics below.
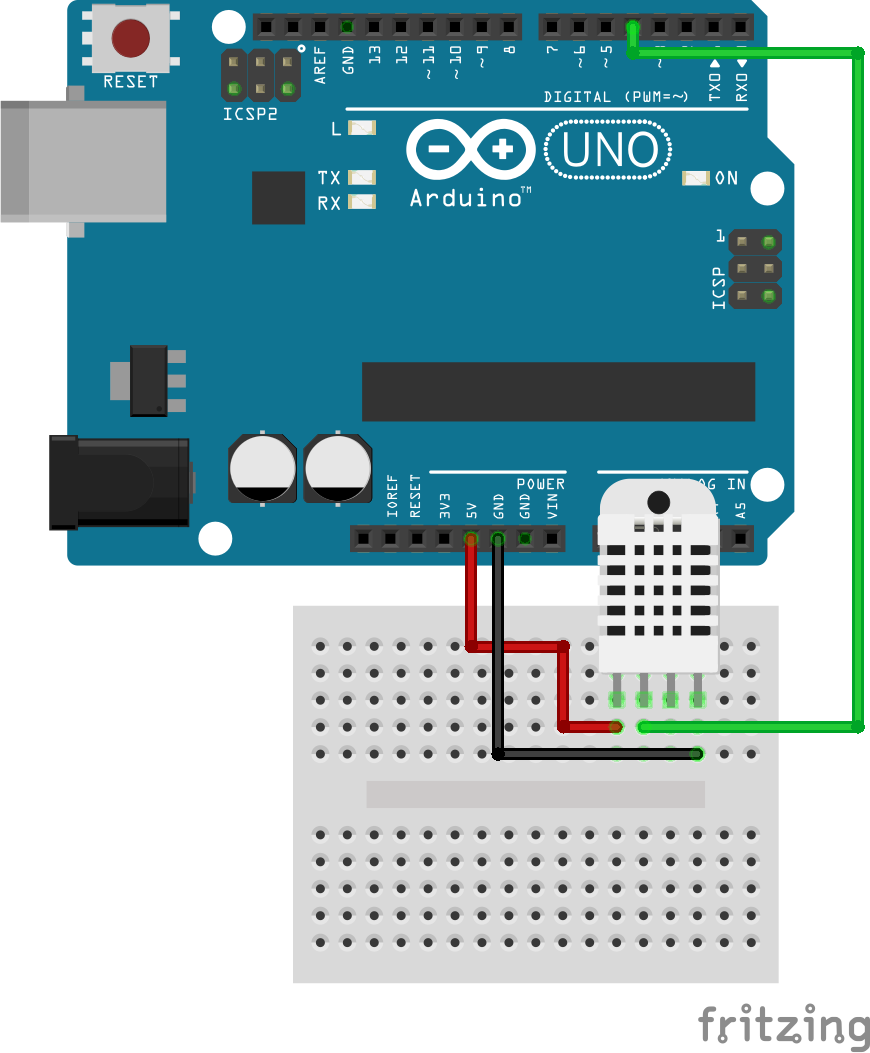
The pin connections between the Arduino and the DHT are further described below.
DHT22 – Arduino
VCC - 5V
GND - GND
Data - D4
Code
The code for the two examples that we will work with are quite simple. You would have, at one point or the other, seen them on this website as we have lots of weather station based tutorials. However, the important thing in both codes is the println() function. The Serial.println() Arduino function prints data to the serial port as human-readable ASCII text followed by a carriage return character (ASCII 13, or ‘\r’) and a newline character (ASCII 10, or ‘\n’). This command takes the same form as Serial.print() statement with the only difference being the newline character which is not associated with the serial.print(). As mentioned during the introduction, everytime the serial.println() command is issued, data is recorded on the serial plotter thus making it very important to this tutorial.
With that said, let’s take a look at the code for the examples starting with the first one.
Code for Plotting the Photoresistor’s Data
To do a brief explanation of how the code for this example works, we start by indicating the pin of the Arduino to which the output of the divider is connected.
//Written by Nick Koumaris
// info@educ8s.tv

int LDRpin = 0;
int analogValue =0;
Next, is the void setup() function, where we initialize the serial port, setting the communication baud rate to 9600.
void setup() {
  Serial.begin(9600);
}
Last but not least, we write the void loop() function. Under this function, we use the analogRead() function to obtain data from the voltage divider pin after which the data is sent to the serial port using the serial.println() command.
void loop() {
  analogValue = analogRead(LDRpin);
  Serial.println(analogValue);
  delay(50);

}
The complete code is shown below.
//Written by Nick Koumaris
// info@educ8s.tv
int LDRpin = 0;
int analogValue =0;

void setup() {
  Serial.begin(9600);
}

void loop() {
  analogValue = analogRead(LDRpin);
  Serial.println(analogValue);
  delay(50);

}
Code to Plot Data from the DHT22 Sensor
The main reason for this example as mentioned earlier is to demonstrate how to plot multiple data representing multiple variables using the serial plotter.
For this example, we will be obtaining and plotting the ambient temperature and humidity from the DHT22 at the same time. To briefly explain the code, we start by including the DHT.h header to utilize the functions in the DHT library.
//Written by Nick Koumaris
// info@educ8s.tv

#include "DHT.h"
Next, we specify the pin of the Arduino to which the signal pin of the DHT sensor is connected and specify the type/model of the DHT being used.
#define DHTPIN 4
#define DHTTYPE DHT22
We also initialize (set to zero) the variables that will hold the temperature and humidity data from the sensor. After this, we create an instance of the DHT library specify the pin of the Arduino to which the signal pin is connected and the type of DHT we are using.
float temperature = 0.0;
float humidity = 0.0;
DHT dht(DHTPIN, DHTTYPE);
Next, we write the void setup() function. We start this function by initializing the serial port, setting its baud rate to 9600 after which we initialize the DHT sensor.
void setup() {
 Serial.begin(9600);
 dht.begin();
 delay(100);
}
The void loop() function, as usual, is where most of the work is done. We start by using the dht.readTemperature() and dht.readHumidity functions to obtain the temperature and humidity value from the sensor. After which we proceed to print them out in a way that the serial plotter understands the difference between the variables. This is the done by printing an empty space between the variables (after the first value, before the second value). Without this empty space between the data, the plotter will see the next println statement as an update to the previous one.
void loop() {

temperature = dht.readTemperature();
humidity = dht.readHumidity();

delay(500);
Serial.print(temperature);
Serial.print(" ");
Serial.println(humidity);

}
The complete code for this example is shown below.
//Written by Nick Koumaris
// info@educ8s.tv
#include "DHT.h"
#define DHTPIN 4
#define DHTTYPE DHT22

float temperature = 0.0;
float humidity = 0.0;
DHT dht(DHTPIN, DHTTYPE);

void setup() {
 Serial.begin(9600);
 dht.begin();
 delay(100);
}

void loop() {

temperature = dht.readTemperature();
humidity = dht.readHumidity();

delay(500);
Serial.print(temperature);
Serial.print(" ");
Serial.println(humidity);

}
Demo
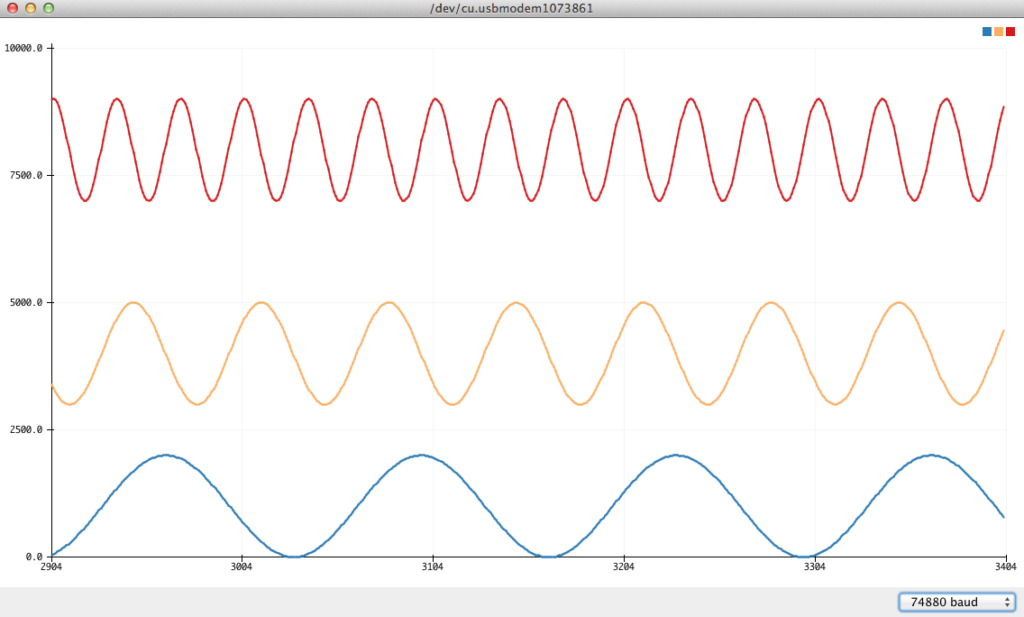
This project is quite simple and I expect no complications to arise, but in case things get funny, do ensure your connections are as described in the schematics. For each example, after double checking your connections, upload the corresponding code to the Arduino board and open the serial monitor. You should see the data being plotted after a while as shown in the images below.
That’s it for this tutorial guys, thanks for reading. If you have any questions or discover new tricks with the recent versions of Arduino IDE that you will like to share, don’t forget to drop comments.
Till next time!
The video version of this tutorial is available on youtube.


")

