

Sensirion Gas/Temp/Humidity Sensor Kit
- Emmanuel Odunlade
- https://twitter.com/emmaodunlade
- emmaodunlade@gmail.com
- 1.792 Views
- moderate
- Tested
- 0 Likes

While browsing through the internet to check up on the latest air quality sensors for use in a project I am working on, I stumbled across the Sensirion environmental sensor shield. Examining the features of the Kit I stumbled on an interesting project based on this Kit. The project was built by an element14 user named Shabaz and I thought a step by step build process for the project might be useful, so today’s project will be based on this.
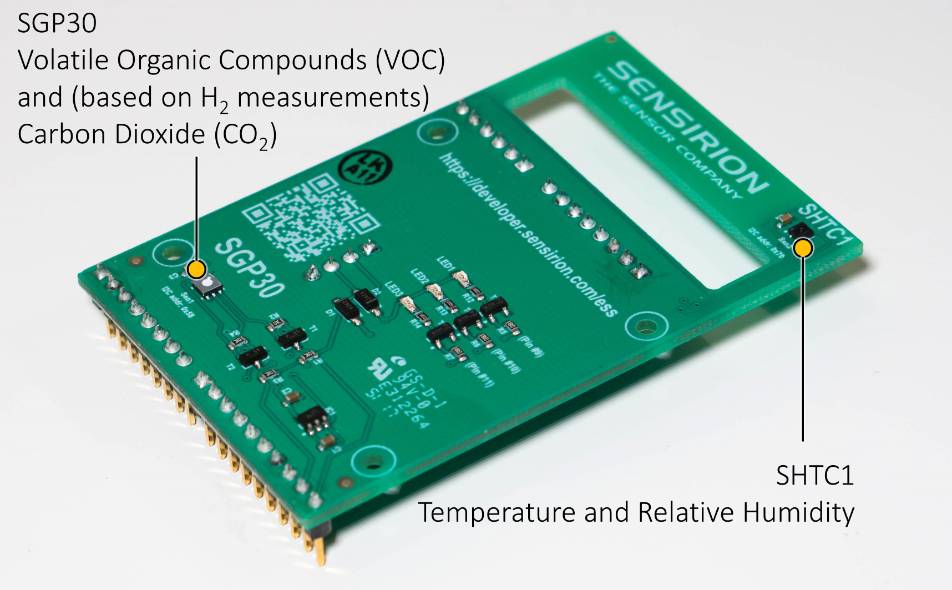
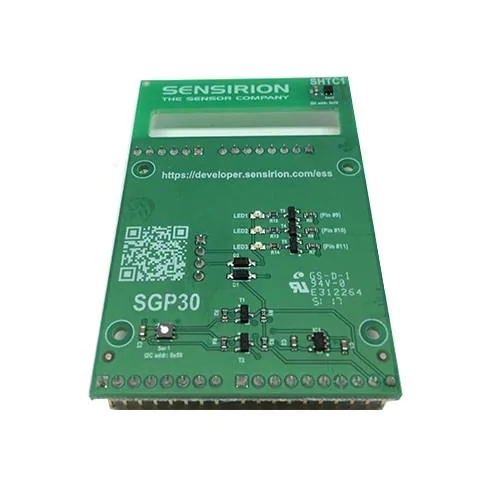
The Sensirion Environmental Sensor Shield (ESS) is a sensor shield that features the Sensirion SHTC1 humidity and temperature sensor along with an SGP30 total VOC and CO2eq sensor. It is designed for use with any microcontroller that supports I2C, and the shield is designed in line with Arduino shield footprints making it ready for use in your Arduino based projects. The board supports both 3.3v and 5v voltage levels making it ideal for 3.3v low power projects.
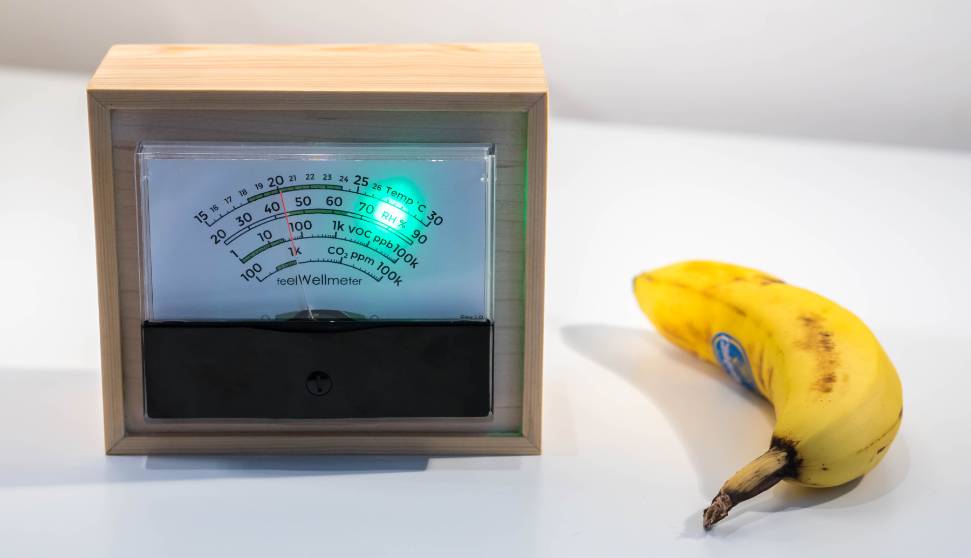
The demo project built by Shabaz was a part of a road test to examine the capabilities of the Sensor shield. The project, using an Arduino Micro as the microcontroller, obtains temperature, humidity, VOC, and CO2 values from the environment using the Sensor shield, and represents in on an analog scale made using the carcass of an ammeter.
At the end of this project, you would know to use the Sensation environmental sensor shield and also create a nice analog meter to present your data.
Required Components
The following components are required to build this project:
- Arduino Micro
- Sensirion Sensor Shield
- 44C2 100uA meter
- Pushbutton
- 47k Resistor
- LED (4 pcs)
- 220R Resistor (4 Pcs)
- Breadboard
- Jumper Wires
All of these components can be purchased from your local hardware store or from the attached links. The Sensirion xxx comes as a shield so, in place of the Arduino micro, you can decide to use any of the other bigger Arduino boards.
Schematics
The schematics for this project is quite straightforward. The Sensirion sensor shield is connected to the Arduino micro via I2C, and other components like the LEDs to indicate the air quality level are connected in a common cathode configuration, while the positive lead of the ammeter dial/coil is connected through a 47k resistor to a PWM pin on the Micro. Connect the components as shown in the image below:
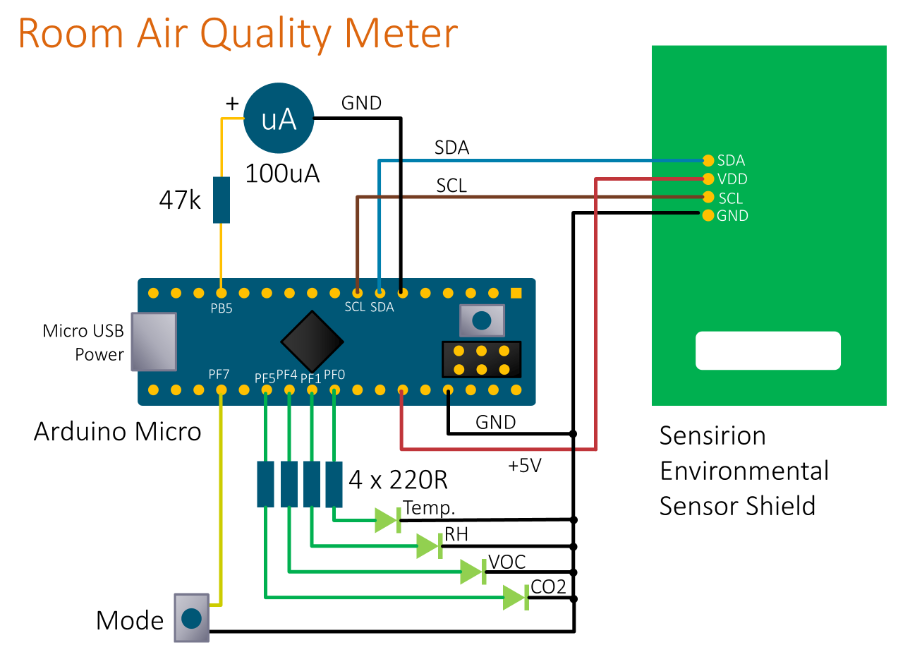
A pin-to-pin map showing how the Sensirion sensor shield is connected to the Arduino is provided below:
Sensor Shield – Arduino
SDA - A4
SCL - A5
VCC - 5V
GND - GND
I believe connections for the other components are straightforward but if you have any issue getting up to speed on them, you can reach out to me via the comment section.
Enclosure
With the components connected, one other thing we need to do is to mount the project inside an enclosure so users can easily reference the needle points.
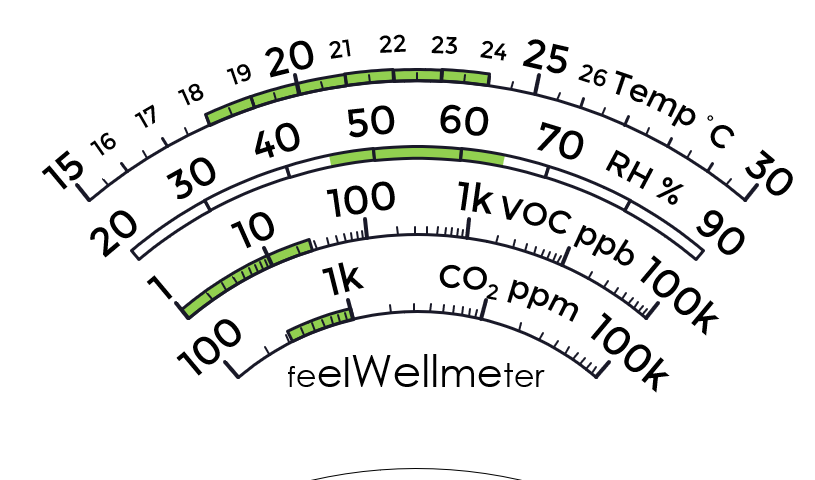
The enclosure adapted by Shabaz was a wooden box with the components stacked inside it. The ammeter was modified with the scale/label inside it swapped with the one that has the feelWellmeter calibration. The scale was created with the help of information from the World Health Organization‘s website and other sources to establish what values of the parameters makes for a good environment conditions. Those value ranges were shaded green on the meter scale.
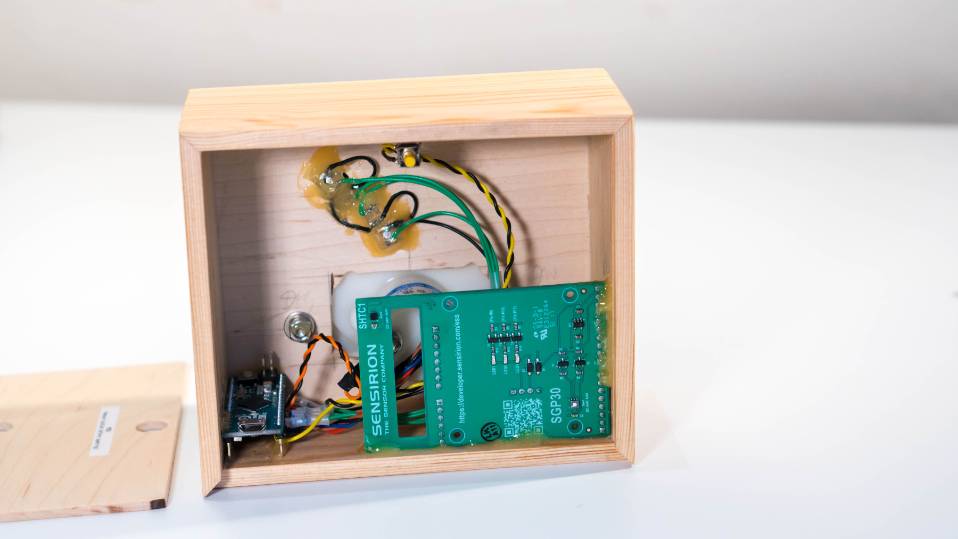
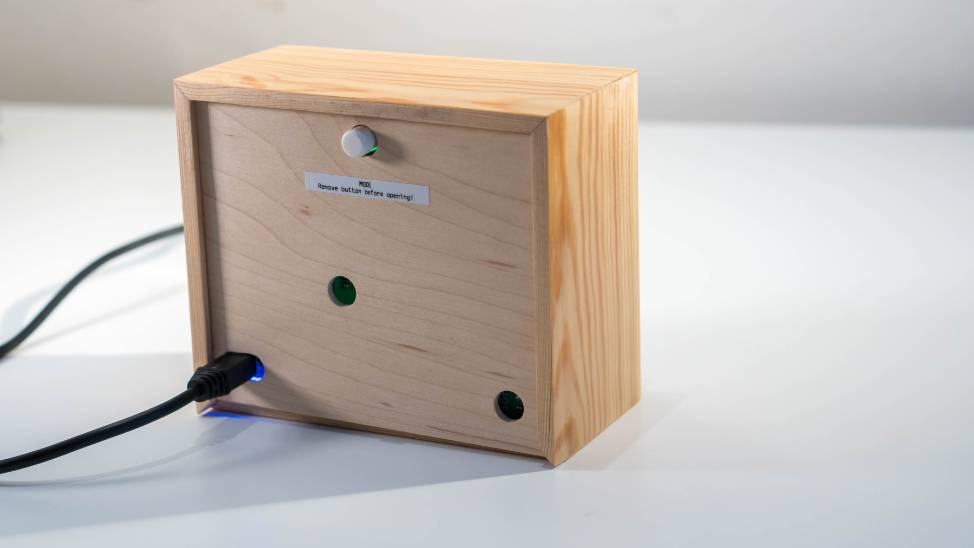
One major thing to note in the enclosure is that the sensors need to be exposed to air. For a real product, this is something that needs to be considered carefully, but for this implementation, Shabaz simply made use of a 10mm diameter holes at the back of the enclosure. Sensirion has SHTxx design guidelines (PDF) which should help if you are planning to implement this on a more professional level.
The enclosure after assembly, with holes for air, is shown below.
Code
With our schematics in place and the components all wired up, the next thing to do is to write the code for the project. One of the nice things about the Sensirion Sensors shield is that it was released alongside an Arduino library with a series of examples to enable users to build projects with the shield, fairly quickly. The code for today’s project will borrow ideas from those examples so they might be worth exploring. The library can be installed directly via the library manager. Launch the library manager by going to Sketch->Include Library->Manage Libraries. On the resulting window, type Sensirion in the search box, and select “Arduino-ess”.
The idea behind the code for this project is simple. When turned on, the Arduino will fetch the data for all four parameters including; temperature, humidity, CO, and VOC from the shield and indicate their level in the air with a movement of the meter’s needle, one after the other in a cycle. For each of the parameters, one of the four LEDs will come up to indicate the parameter currently being displayed. If the attached button is pressed, the cycling will stop, and the parameters can be manually cycled by pressing the button. A further press of the button will take the device back into automatic cycle mode.
As usual, I will do a quick run through the code and post the complete version at the end of the tutorial.
The code starts with include statements for all the libraries to be used. This includes the math.h and EEPROM Library in addition to the Sensirion library. The math and EEPROM library comes pre-installed so we won’t need to download or install them.
#include <math.h>
#include <EEPROM.h>
#include <sensirion_ess.h>
Next, we declare variables and global constants to hold different parameters to be used in the code.
#include <math.h>
#include <EEPROM.h>
#include <sensirion_ess.h>

// *************** definitions **********************
#define meter OCR1A // PB5
#define BUTTON 18
#define LED_TEMP 23
#define LED_RH 22
#define LED_VOC 21
#define LED_CO2 20
#define LED_BOARD LED_BUILTIN
#define LED_BOARD_OFF digitalWrite(LED_BOARD, LOW)
#define LED_BOARD_ON digitalWrite(LED_BOARD, HIGH)
#define MODE_TEMP 0
#define MODE_RH 1
#define MODE_VOC 2
#define MODE_CO2 3
#define MODE_NONE 99
#define VIEW_STATIC 0
#define VIEW_DYNAMIC 1
#define DEB_NONE 0
#define DEB_TIME 1
#define DEB_TIME2 2
#define IS_PRESSED LOW
#define IS_UNPRESSED HIGH
#define DEBOUNCE_TIME 4
#define METER_TIME 2
#define VIEW_EXP 1000
#define VSIZE 8


// *************** globals and constants *************
const int led_pin[]={LED_TEMP, LED_RH, LED_VOC, LED_CO2};
int mode=MODE_TEMP;
int view=VIEW_DYNAMIC;
int fast_tick=0;
int slow_tick=0;
int led_status=0;
int button_status=DEB_NONE;
int button_time=0;
int shimmer=0;
int view_time=0;
int update_view=0;
int meter_update_timer=0;
int changed_mode=0;
int mval[4];
int vocbuffer[VSIZE]; // VOC values are low-pass filtered
int mmin=100;
int mmax=3500;
Next, we create an instance of the Sensirion library followed by a group of functions to make the project neat and readable.
SensirionESS ess;
The first function is the toggle_board_led() function which basically flashes the Arduino Micro’s onboard LED when called.
// Toggle board LED as required (used for troubleshooting)
void toggle_board_led(void)
{
  if (led_status){
  LED_BOARD_OFF;
  led_status=0;
  } else {
    LED_BOARD_ON;
    led_status=1;
  }
}
Next is the set_mode_led() function which is used to indicate which of the four parameters is being displayed.
// Set mode LED on
void set_mode_led(int mode) {
  int i;
  for (i=0; i<4; i++)
  {
    digitalWrite(led_pin[i], LOW);
  }
  if (mode<4) {
    digitalWrite(led_pin[mode], HIGH);
  }
}
Next is the signal function which is used to set the timer tick.
// *************** timer tick ************************
SIGNAL(TIMER3_COMPA_vect) // this occurs 1000 times per second
{
  fast_tick++;
  if (fast_tick>100) {
    fast_tick=0;
  }
  else {
    return; // we only want a 10 msec tick
  }

  // this code executes every 10 msec

  // blink the mode light a few times if mode has just been set to dynamic
  if (shimmer>0) {
    shimmer++;
    if (shimmer%8) {
      set_mode_led(99);
    } else if ((shimmer+4)%8) {
      set_mode_led(mode);
      if (shimmer>32) shimmer=0;
    }
  }

  // time to update the view if we're in dynamic mode?
  if (view==VIEW_DYNAMIC) {
    view_time++;
    if (view_time>VIEW_EXP) {
      update_view=1;
    }
  }

  if (button_status==DEB_NONE) {
    if (digitalRead(BUTTON)==IS_PRESSED) {
      button_status=DEB_TIME;
      button_time=0;
      if (view==VIEW_DYNAMIC) {
        view=VIEW_STATIC;
        mode=MODE_TEMP;
      } else {
        mode++;
        if (mode>3) {
          view=VIEW_DYNAMIC;
          view_time=0;
          mode=MODE_TEMP;
          shimmer=1;
        }
      }
      changed_mode=1;
    }
  } else if (button_status==DEB_TIME) {
    button_time++;
    if (button_time>DEBOUNCE_TIME) {
      button_time=0;
      if (digitalRead(BUTTON)==IS_UNPRESSED) {
        button_status=DEB_TIME2;
      }
    }
  } else if (button_status==DEB_TIME2) {
    button_time++;
    if (button_time>DEBOUNCE_TIME) {
      button_time=0;
      button_status=DEB_NONE;
    }
  }

  if (changed_mode)
  {
    set_mode_led(mode);
  }
}
It is followed by the Manual_debounce function which is used to filter out noise in button press.
void manual_debounce(void)
{
  delay(50);
  while(digitalRead(BUTTON)==IS_PRESSED) {
    delay(10);
  }
  delay(50);
}
Next is the cal_mode function, which is essentially used to calibrate the sensor readings with the meter. The minimum and maximum values are stored in the EEPROM.
void cal_mode(void)
{
  int i, j, k;
  int maxval, minval;
  minval=0;
  maxval=4500;
  int wait_press=1;
  for (k=0; k<4; k++)
  {
    digitalWrite(led_pin[k], HIGH);
  }
  manual_debounce();
  while(wait_press) {
    for (i=3500; i<4500; i=i+10) {
      meter=i;
      for (j=1; j<200; j++) {
        delay(1);
        if (digitalRead(BUTTON)==IS_PRESSED) {
          maxval=i;
          i=4500;
          j=9999;
          wait_press=0;
          digitalWrite(led_pin[3], LOW);
        }
      }
    }
  }
  manual_debounce();
  wait_press=1;
  while(wait_press) {
    for (i=0; i<200; i=i+10) {
      meter=i;
      for (j=1; j<200; j++) {
        delay(1);
        if (digitalRead(BUTTON)==IS_PRESSED) {
          minval=i;
          i=900;
          j=9999;
          wait_press=0;
          digitalWrite(led_pin[2], LOW);
        }
      }
    }
  }
  manual_debounce();
  // write minval and maxval into EEPROM
  EEPROM.write(0x01, (minval & 0x00ff));
  EEPROM.write(0x02, ((minval>>8) & 0x00ff));
  EEPROM.write(0x03, (maxval & 0x00ff));
  EEPROM.write(0x04, ((maxval>>8) & 0x00ff));
  EEPROM.write(0x00, 0xaa);
  digitalWrite(led_pin[2], HIGH);
  digitalWrite(led_pin[3], HIGH);
  delay(1000);
  set_mode_led(99);
  mmin=minval;
  mmax=maxval;
}
Next, are the functions used in fetching the latest value of the parameters being measured including the VOC, the temperature, the Relative humidity, and the CO2.
// calculate the moving average
int vocavg(void)
{
  int i;
  int tot=0;
  for (i=0; i<VSIZE; i++) {
    tot=tot+(vocbuffer[i]/VSIZE);
  }
  return tot;
}

// support a min temperature of 15 deg C, and a range of 15 deg C (i.e. max will be 30 deg C)
int temp2pwm(float x)
{
  int p;
  if (x>30.5) x=30.5; // max temperature will be off the scale by 0.5 deg C
  x=x-15.0; // min temperature to be displayed will be 15 deg C
  p=(int)((((float)(mmax-mmin))/15.0)*x);
  p=p+mmin;
  return(p);
}

// support a min RH value of 20%, and a range of 70% (i.e. max will be 90%)
int rh2pwm(float x)
{
  int p;
  if (x>92.0) x=92.0; // max RH will be off the scale by 2%
  x=x-20.0; // min RH to be displayed will be 20%
  p=(int)((((float)(mmax-mmin))/70.0)*x);
  p=p+mmin;
  return(p);
}

// support a VOC range from 1 to 100k ppb on a log scale
// log(1) is 0, log(100k) is 5
int voc2pwm(uint16_t x)
{
  double i;
  int p;
  i=log10((double)x);
  p=(int)((((float)(mmax-mmin))/5.0)*((double)i));
  p=p+mmin;
  return(p);
}

// support a CO2 range from 100 to 100k ppm on a log scale
// log(100) is 2, log(100k) is 5
int co22pwm(uint16_t x)
{
  double i;
  int p;
  i=log10((double)x);
  i=i-2.0; // min to be displayed is 100, i.e. 10^2.0
  p=(int)((((float)(mmax-mmin))/3.0)*((double)i));
  p=p+mmin;
  return(p);
}
With this done, we move to the void setup function.
The function starts with the initialization of serial communication so the serial monitor can be used for debugging purposes and the declaration of pinMode of the pins to which LEDS and the pushbutton are connected.
// *************** setup code ************************
void setup() {
  int i;

  Serial.begin(9600);
  delay(1000); // let console settle

  // Set LEDs as outputs
  for (i=0; i<4; i++)
  {
    pinMode(led_pin[i], OUTPUT);
  }
  pinMode(LED_BOARD, OUTPUT);

  LED_BOARD_OFF;

  // set up button
  pinMode(BUTTON, INPUT_PULLUP);
Next, we configure the PWM properties of the pin to which the meter is connected and perform calibration based on the state of the button.
// start up PWM mode on the meter output pin
  meter=0;
  DDRB |= 0x20; // set PB5/OC1A pin as output
  ICR1 = 4000;  // freq set for 500Hz. ICR1 = (16M/8)/freq = 2M/freq
  TCCR1A = 0x82; // clear OC1A on compare match
  TCCR1B = 0x1a; // clkio divided by 8, mode 14 waveform: fast PWM, top is ICR1

  // is button pressed at power-on?
  if (digitalRead(BUTTON)==IS_PRESSED) {
    cal_mode();
  } else {
    if (EEPROM.read(0x00)==0xaa)
    {
      i=EEPROM.read(0x02);
      i=i<<8;
      mmin=i|(EEPROM.read(0x01) & 0xff);
      i=EEPROM.read(0x04);
      i=i<<8;
      mmax=i|(EEPROM.read(0x03) & 0xff);
      // sanity
      if ((mmin<0) || (mmin>200)) mmin=100;
      if ((mmax<3000) || (mmax>4500)) mmax=3500;
    }
  }
Finally, we initialize the sensor shield and proceed to the void loop() function.
 // light up the mode indication
  set_mode_led(mode);

  // initialize sensors
  ess.initSensors();

}
The void loop function is quite straightforward thanks to the functions created earlier.
It starts with the initialization of local variables to hold humidity temperature and CO and VOC. Next commands from the Sensirion library to get readings from the sensor shield into the local variables that we created.
void loop() {
  int i;
  float tf, hf;
  uint16_t vu, cu;

  // perform measurements, and convert to a PWM width value
  ess.measureIAQ(); // measure first to ensure proper timing
  ess.measureRHT();
  tf=ess.getTemperature();
  hf=ess.getHumidity();
  vu=ess.getTVOC();
  cu=ess.getECO2();
  mval[0]=temp2pwm(tf);
  mval[1]=rh2pwm(hf);
  mval[2]=voc2pwm(vu);
  mval[3]=co22pwm(cu);
  delay(ess.remainingWaitTimeMS());

  toggle_board_led(); // just as an internal heartbeat indicator
Depending on the mode (based on button press) we update the meter’s needle with the new values and also print the values on the serial monitor.
// if in dynamic view setting, then the mode is updated periodically
  if (update_view)
  {
    update_view=0;
    view_time=0;
    mode++;
    if (mode>3) mode=0;
    set_mode_led(mode);
    if (mode==MODE_VOC) changed_mode=1;
  }

  // update the meter needle
  if (changed_mode)
  {
    changed_mode=0;
    if (mode==MODE_VOC) {
      // set the VOC filter buffer
      for (i=0; i<VSIZE; i++) {
        vocbuffer[i]=mval[mode];
      }
    }
  }

  if (mode==MODE_VOC) {
    append_vocbuffer(mval[mode]);
    meter=vocavg();
  } else {
    meter=mval[mode];
  }

  // output the values via serial, as a sanity check
  Serial.print("Temp: ");
  Serial.print(tf);
  Serial.print("Hum: ");
  Serial.print(hf);
  Serial.print("VOC: ");
  Serial.print(vu);
  Serial.print("CO2: ");
  Serial.print(cu);
  Serial.println();
}
That’s all. The complete code for the project is attached under the download section.
Demo
With the code complete and the hardware setup in place, we can now upload the code to the device. Connect the device to your computer via a USB Cable. Hit the verify button to ensure you have all the libraries installed and there are no errors. With this done successfully, hit the upload button. Your “feelWellmeter’ should now be live.
To calibrate the meter, hold down the button at power on. The device will go into the calibration model with the needle moving slowly. Once the needle gets to the point you wish to consider as the minimum point on the scale, press the button. This will store that particular position of the needle as the minimum point. Do the same to set the max point. Wait for the needle to get to the point you’d like to take as maximum and press the button. Per our code, this min and max value will be stored in the EEPROM and will be remembered by the device at the next bootup.
With this done, the device should now begin cycling through the parameters, moving the needle and indicating the parameter in focus with an LED.
That’s it! Your very own feelWellmeter.
Further Steps
The I2C interface possessed by the sensor shield makes it easy to connect the shield to any kind of MCU. So you could easily connect the shield to a board like the ESP32 and stream the data online, or even eliminate the complications associated with this version of the feelWellmeter and build a digital version using a TFT display.
That’s it for this tutorial. If you have issues getting any part of it to work, feel free to shoot me a comment via the comment section below.
All due credits to Shabaz for the project.