Raspberry Pi Web-Based Data logger using MySQL and PHP
Over the past few weeks, we worked on different projects around IoT. Today, we will continue on this track and we will build a web-based data logger using the Raspberry Pi 3 and the Pi Sense Hat.
Over the past few weeks, we worked on different projects around IoT. Today, we will continue on this track and we will build a web-based data logger using the Raspberry Pi 3 and the Pi Sense Hat.
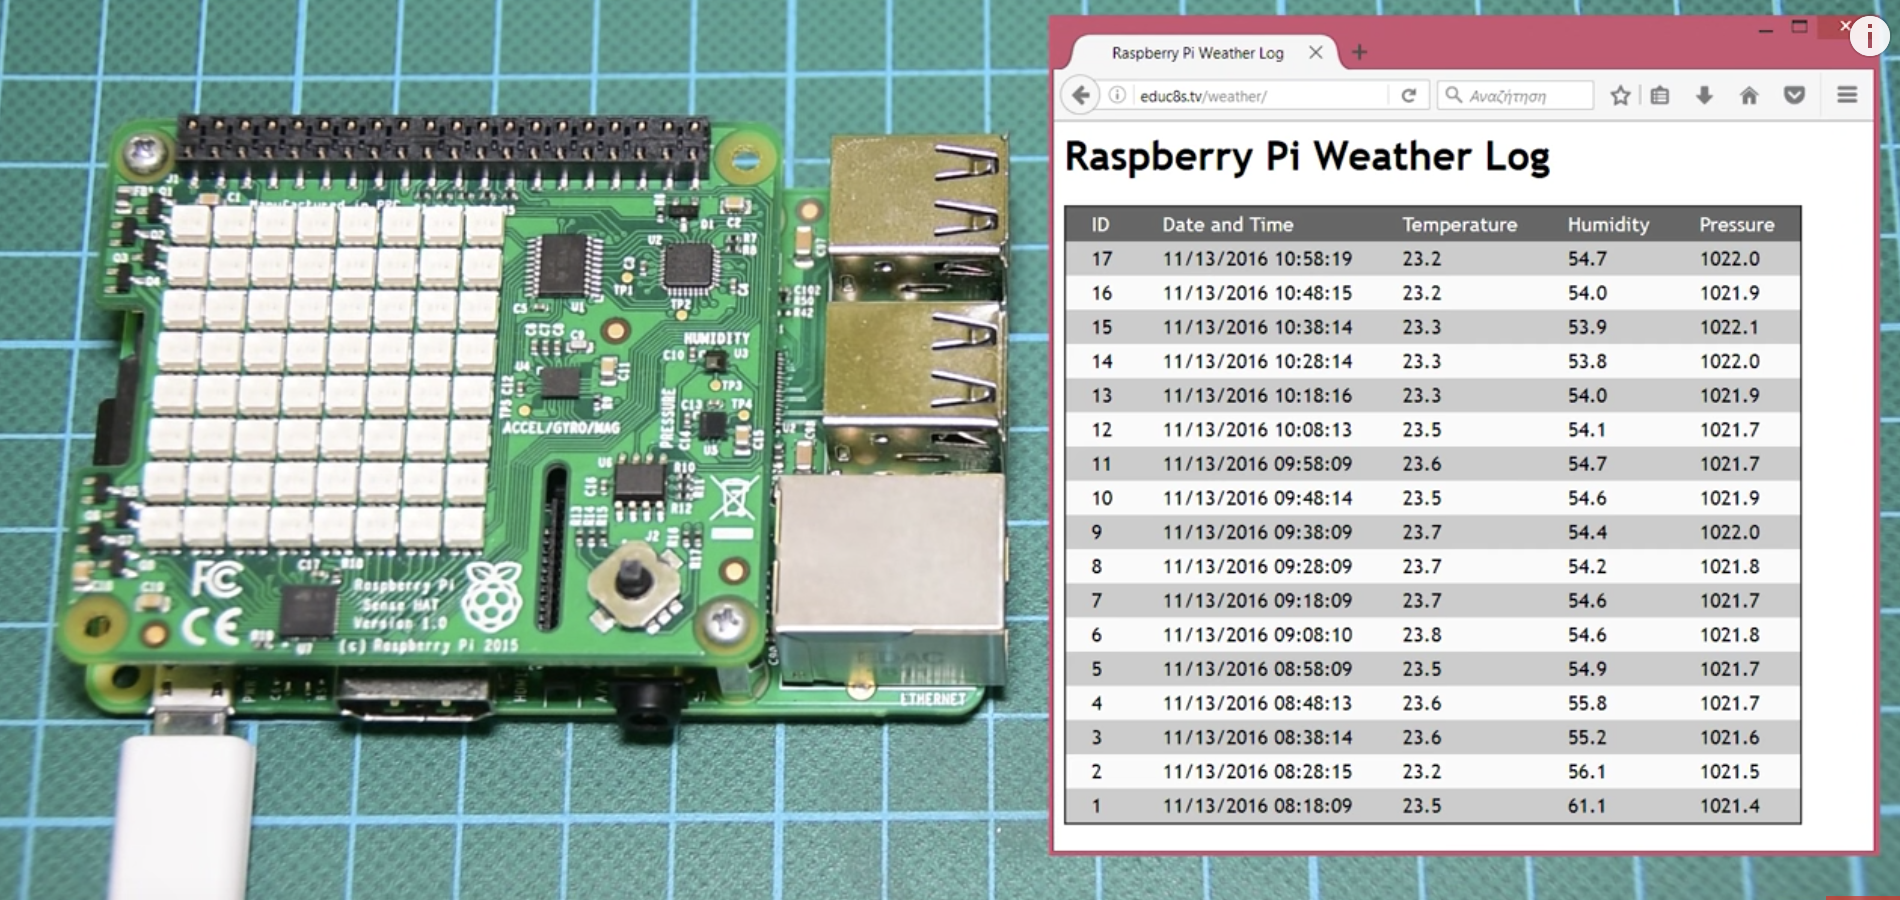
For this project, we will designate the Raspberry Pi to measure temperature, humidity and barometric pressure using the Pi Sense Hat and send the data (at 10-minute intervals) via WiFi to an online webserver, which stores the data in a MySQL database and displays them using a simple table on a webpage. The data will be online on a live webpage which means, it can be viewed from anywhere around the world.
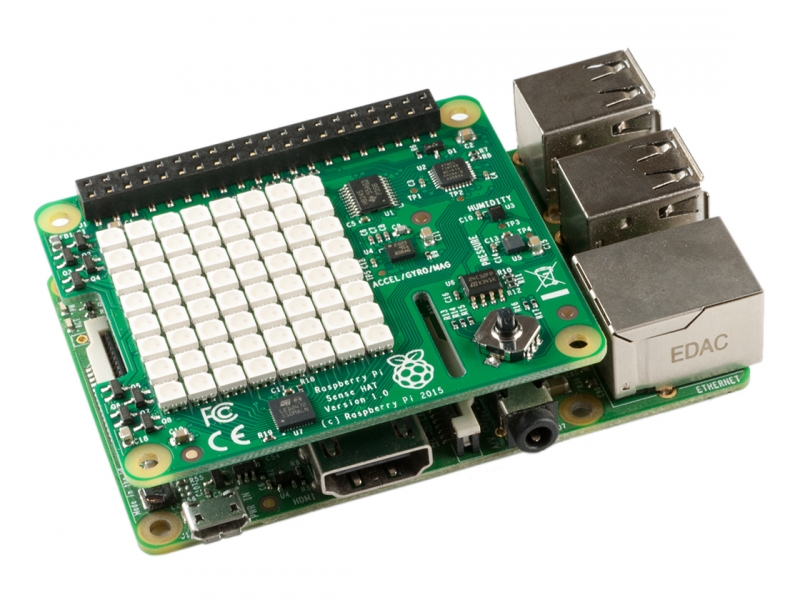
At the heart of today’s project is the Raspberry Pi 3 and raspberry Pi Sense Hat. The Sense Hat is an add-on board for the Raspberry Pi, which has many sensors, including a temperature sensor, a humidity sensor, a barometric pressure sensor (all of which will be used for today’s tutorial) among others. The Sense hat makes it easy to use all of these sensors without the stress and errors associated with wiring them. All of the sensors have been routed to pins which connect to the Raspberry Pi GPIO and by using the sense hat Python library, we can easily use simple commands to obtain data from the sensors on the board.
At the end of today’s tutorial, you would know all that is needed to upload data from the Raspberry Pi to a remote webserver.
Required Components
The following components are required to build this project;
- Raspberry Pi 3 with Necessary accessories
- Sense Hat
- Power Bank
In addition to the components mentioned above, we will also need a hosting account to host the web server and database at which data will be stored. For this purpose, you can use any web hosting platform you desire but I will recommend Bluehost as I have been using them for a number of years.
As usual, the specific components used for this tutorial can be purchased via the attached links.
Schematics
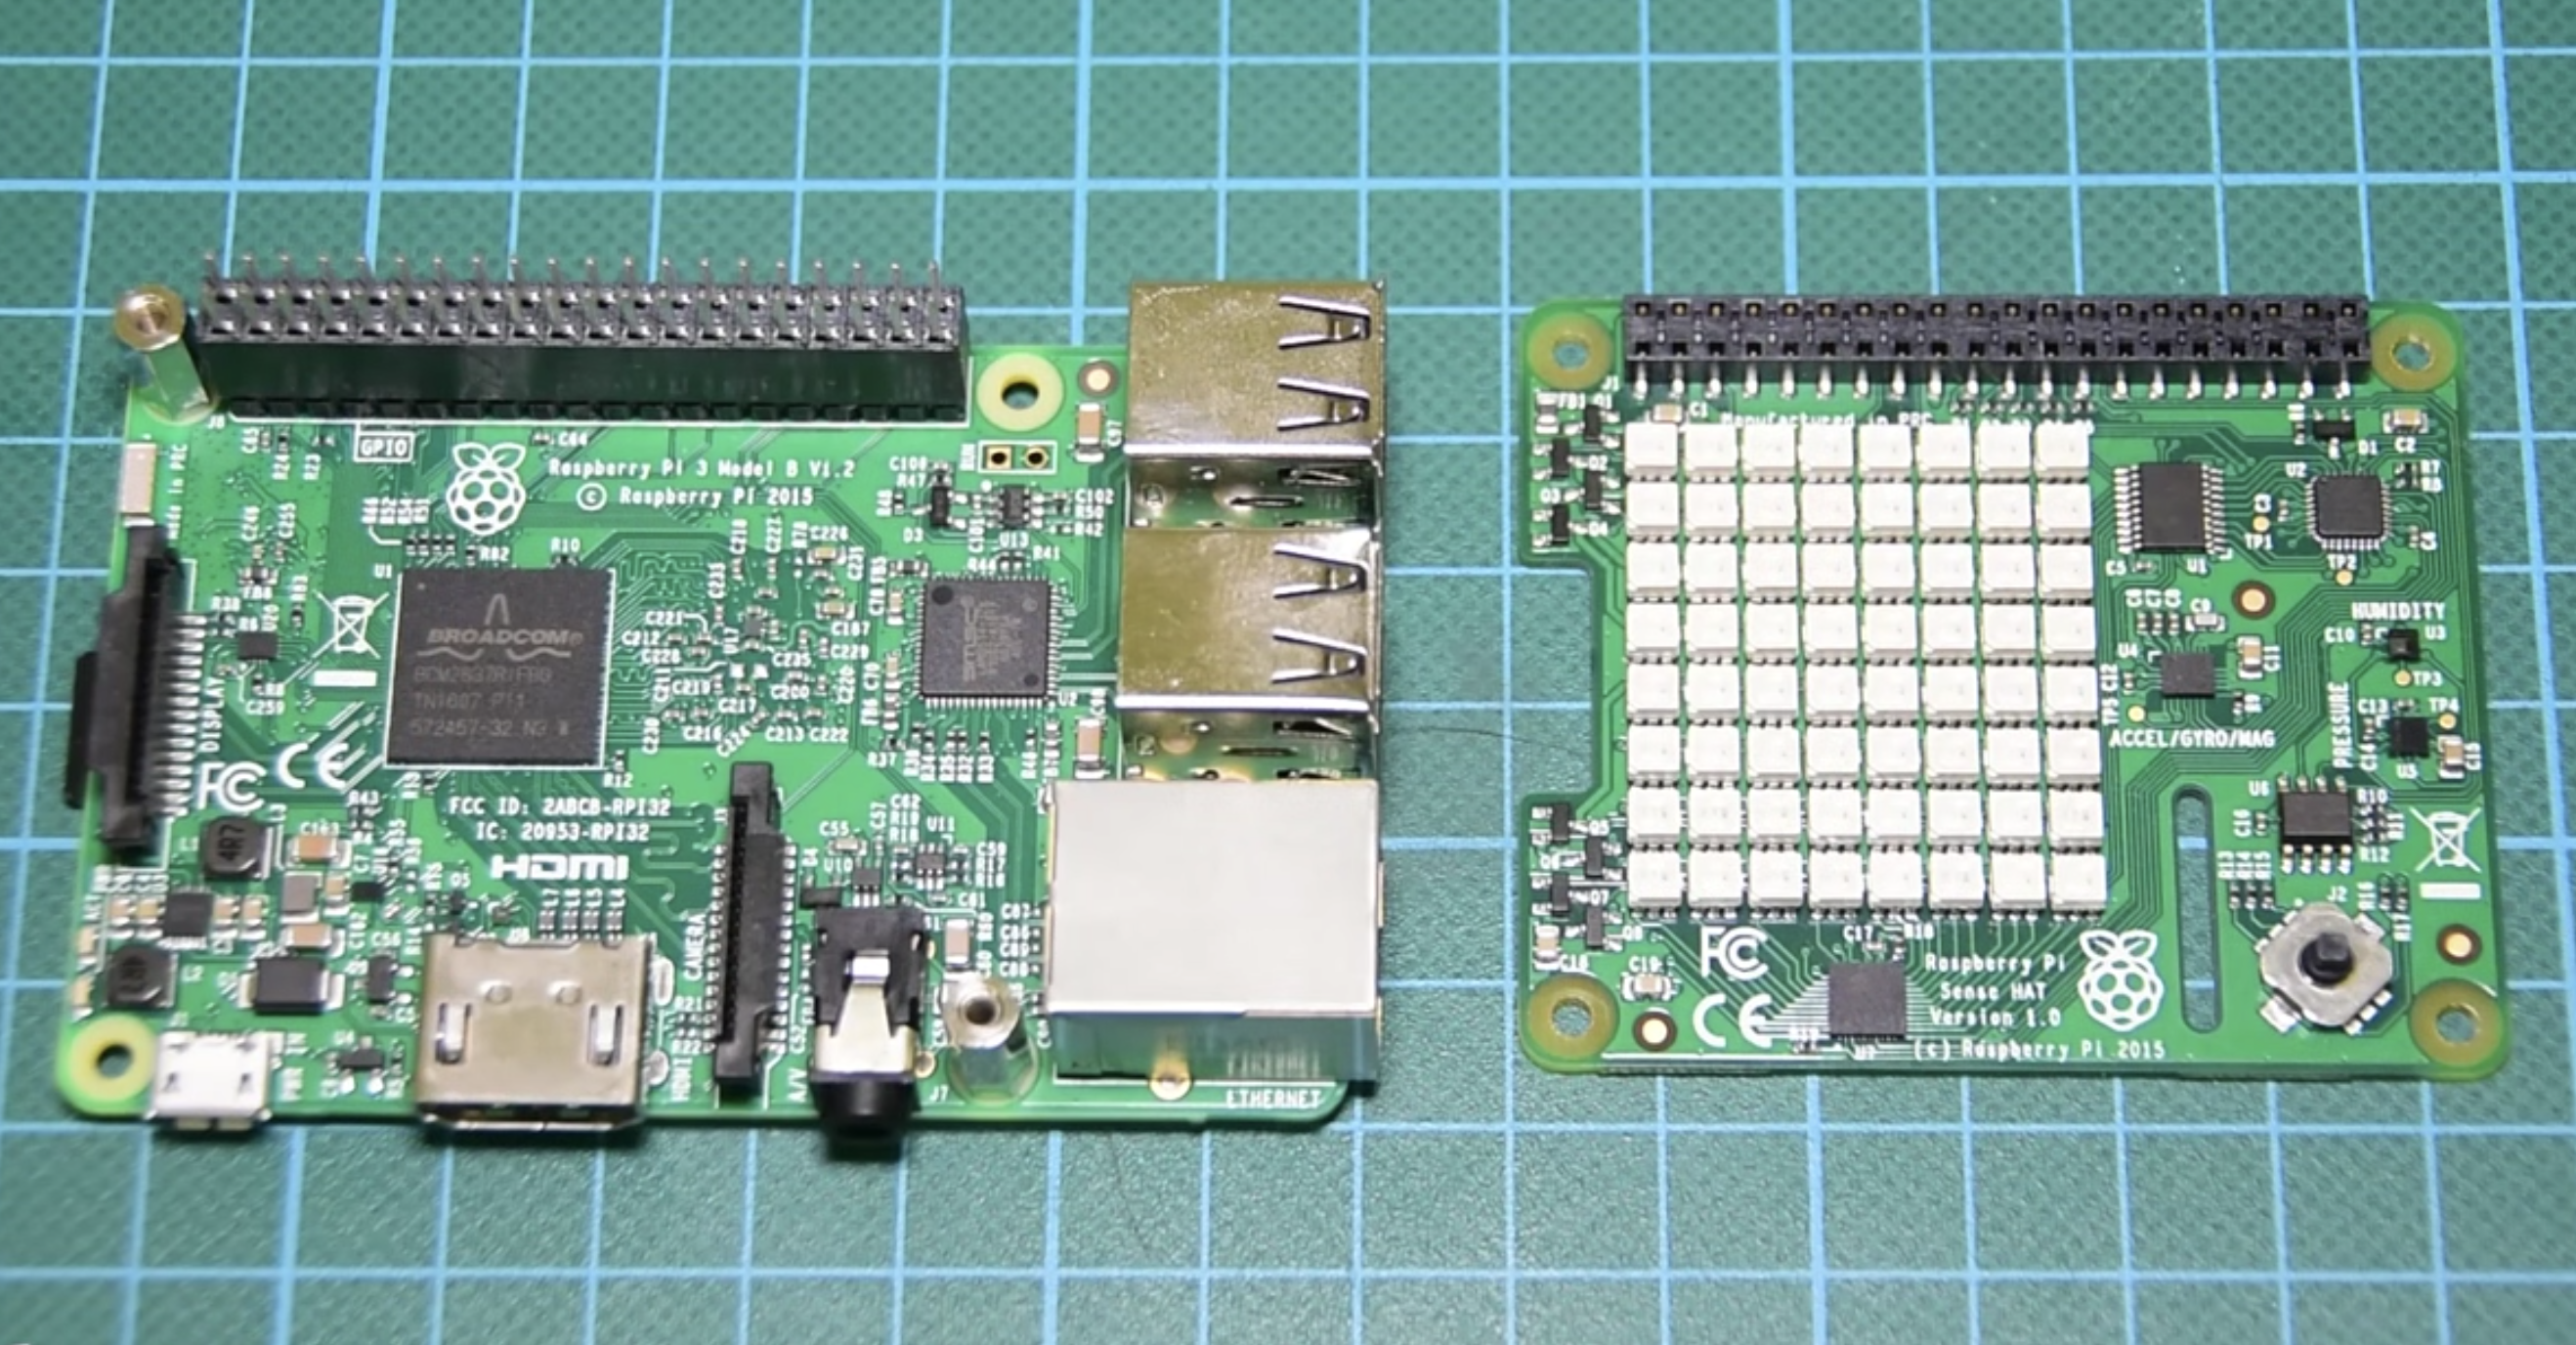
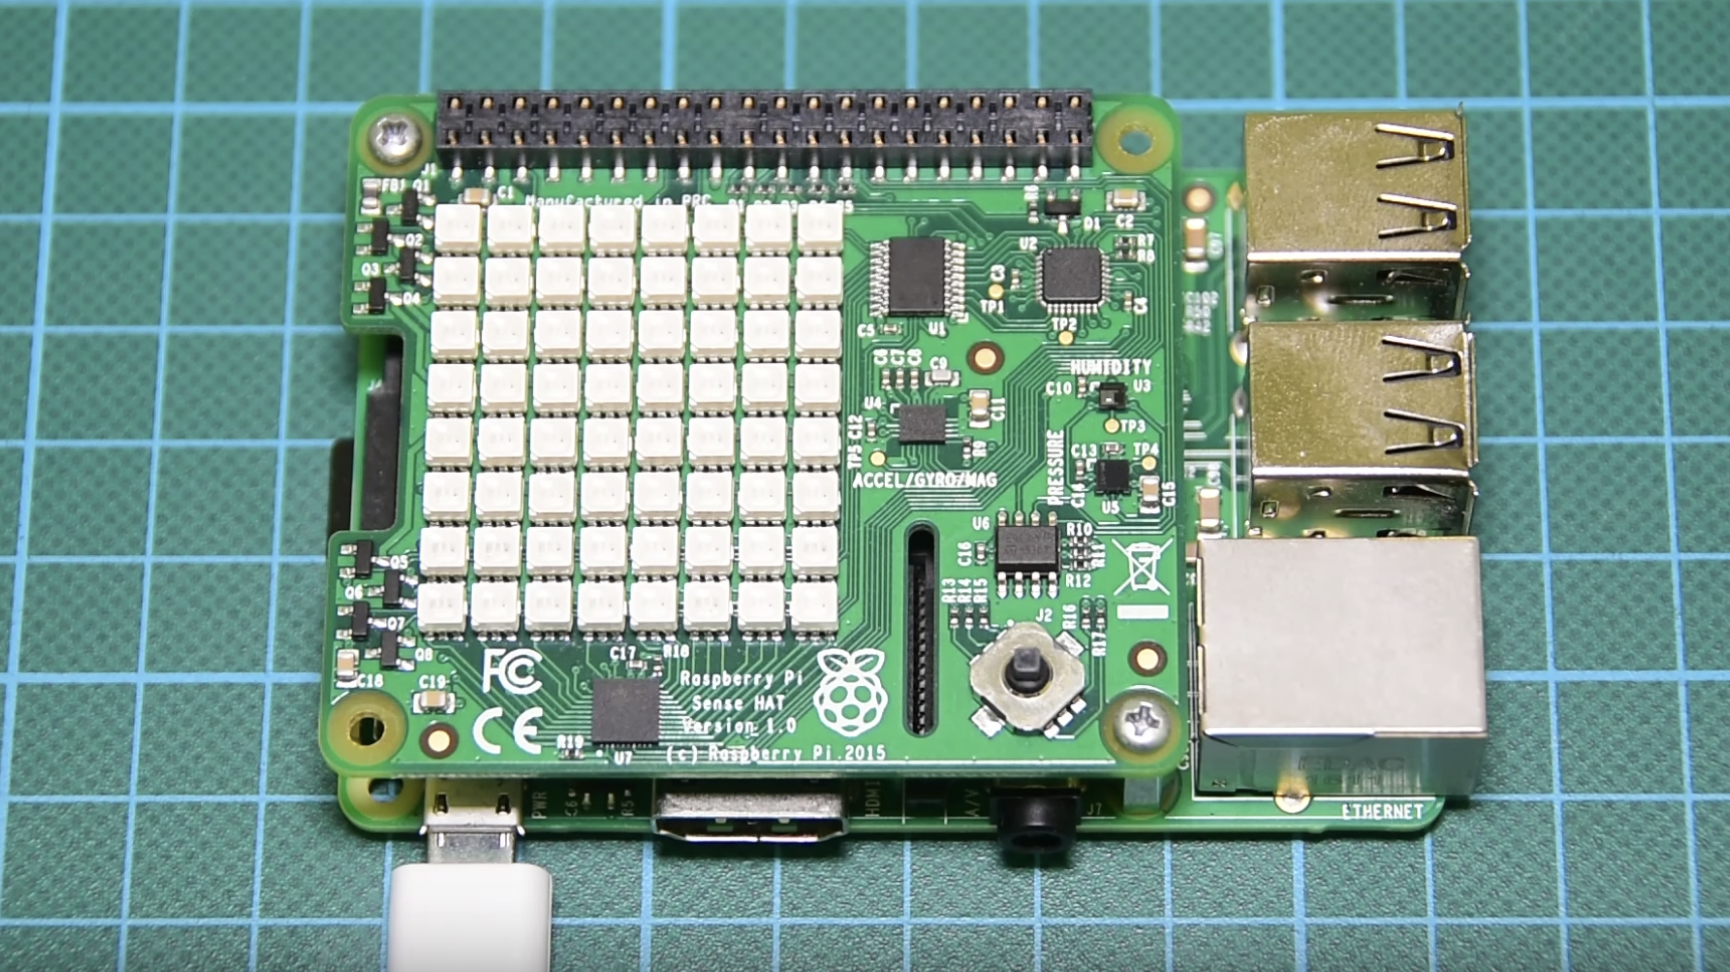
As mentioned during the introduction, the main components for today’s tutorial include the Raspberry Pi and the Sensehat. The Sensehat comes as a shield and thus directly plugs on the Raspberry Pi. Thus, we do not need a schematic, just ensure you plug the Sensehat on the Pi as shown in the image below.
An alternative to the Sensehat could be to buy sensors to measure each of the parameters to be monitored but using the Sensehat reduces the complexity of the project, reduces the number of wires around and helps make the system compact for easy packaging.
Code
The code of the project consists of two parts; The Python script which will run on the Raspberry Pi, and the group of PHP scripts which will run on the web server. We will take a look at both codes and I will do a brief explanation of what the important part of the codes are doing, starting with the PHP Script for the server.
Before reviewing the server code, its obvious that you need to ensure you have an active hosting account which will host our code. Bluehost mentioned above offer both free and paid accounts which go for around $4 monthly.
To jump to the server side of the project, we start by creating the MySQL database to store all the data. The process of creating a database is quite long so it won’t be covered in this tutorial but there are tons of tutorial around it online. The database is named DATA and it has 5 columns which stand for; Entry ID, date, temperature, humidity and barometric pressure.
There are three important PHP scripts that will run on the server. The first one (named connect.php) is responsible for connecting to the database. It contains the configuration settings for the database including the username, the database password, and the hostname.
The script is short and fairly easy to follow. We start by declaring the doctype and entering the server username, password and hostname into the corresponding variables, then use the mysql_pconnect() function, to connect to the database. The last line of code is used to specify the name of the database to be connected to, which in this case is called “data“. Feel free to change the name as per your database name.
<?php
$MyUsername = "yourDatabaseUsername";  // enter your username for mysql
$MyPassword = "yourFatabasePassword";  // enter your password for mysql
$MyHostname = "localhost";      // this is usually "localhost" unless your database resides on a different server

$dbh = mysql_pconnect($MyHostname , $MyUsername, $MyPassword);
$selected = mysql_select_db("yourDatabaseName",$dbh); //Enter your database name here
?>
The next PHP file is the add_data.php file. This is the script which the Raspberry Pi will send the data that needs to be stored. The script connects to the MySQL database (using the connect.php script) and stores data in the database.
Like the previous script, we start by declaring the doctype as PHP after which we include the connect.php file we created earlier.
<?php
    // Connect to MySQL
    include("connect.php");
Next, we set the default time zone, along with the date and call the time() function to provide a time stamp with the accurate time and date of the data to be logged.
  date_default_timezone_set('Europe/Athens');
 $dateS = date('m/d/Y h:i:s', time());
echo $dateS;
Next, we create a query and use “INSERT INTO” command to obtain the data from the Raspberry Pi and make ready to be stored in the database. With this done, the mysql_query() function is then called and the data stored.
$SQL = "INSERT INTO yourdatabasename.data (date,temperature,humidity,pressure) VALUES ('$dateS','".$_GET["temp"]."','".$_GET["hum"]."','".$_GET["pr"]."')";

// Execute SQL statement
mysql_query($SQL);
Lastly, is the index.php file. This represents the main web page where all the stored information is displayed. The index.php script connects to the database (also using the connect.php script), obtain the stored data, and display them in an HTML formatted table.
For the index.php script, we start with the same lines similar to the others. We indicate the doctype and include the connect.php file.
<?php
    // Start MySQL Connection
    include('connect.php');


?>
Next, we write the HTML code to create the table which will be displayed on the webpage. Few lines of CSS were also added to give it a nice look.
<html>
<head>
    <title>Raspberry Pi Weather Log</title>
    <style type="text/css">
        .table_titles, .table_cells_odd, .table_cells_even {
                padding-right: 20px;
                padding-left: 20px;
                color: #000;
        }
        .table_titles {
            color: #FFF;
            background-color: #666;
        }
        .table_cells_odd {
            background-color: #CCC;
        }
        .table_cells_even {
            background-color: #FAFAFA;
        }
        table {
            border: 2px solid #333;
        }
        body { font-family: "Trebuchet MS", Arial; }
    </style>
</head>

    <body>
        <h1>Raspberry Pi Weather Log</h1>


    <table border="0" cellspacing="0" cellpadding="4">
      <tr>
            <td class="table_titles">ID</td>
            <td class="table_titles">Date and Time</td>
            <td class="table_titles">Temperature</td>
            <td class="table_titles">Humidity</td>
            <td class="table_titles">Pressure</td>
          </tr>
Next, we write the concluding PHP script to fetch data from the database and fill to the table created above.
<?php


    // Retrieve all records and display them
    $result = mysql_query("SELECT * FROM data ORDER BY id DESC");

    // Used for row color toggle
    $oddrow = true;

    // process every record
    while( $row = mysql_fetch_array($result) )
    {
        if ($oddrow)
        {
            $css_class=' class="table_cells_odd"';
        }
        else
        {
            $css_class=' class="table_cells_even"';
        }

        $oddrow = !$oddrow;

        echo '<tr>';
        echo '   <td'.$css_class.'>'.$row["id"].'</td>';
        echo '   <td'.$css_class.'>'.$row["date"].'</td>';
        echo '   <td'.$css_class.'>'.$row["temperature"].'</td>';
        echo '   <td'.$css_class.'>'.$row["humidity"].'</td>';
        echo '   <td'.$css_class.'>'.$row["pressure"].'</td>';
        echo '</tr>';
    }
?>
The complete code for each of the PHP files is attached in the file under the download section.
With the server files written, it is time to write the Python file which will run on the Raspberry Pi. The function of this script is simply to obtain temperature, humidity and barometric pressure from the Sense Hat and send that data to the server.
For the Python code, we will use the urllib2 library, the sensehat library, and the OS library. The OS library and the urllib2 may already come installed depending on your python distro. If they don’t, you need to install them alongside the sense hat python library too.
To do a short explanation of the code; we start by importing all of the libraries that we will use for the project (all mentioned above), after which we create an instance of the sensehat library and store in the variable sense.
import os
import threading
import urllib2
from sense_hat import SenseHat


sense = SenseHat()
Next, we create the readsensor() function.
We start by declaring and initializing variables to hold corresponding information. Ensure the variables are declared global so that other functions can access them.
def readSensor():

  global temperature
  global humidity
  global pressure
  global cpu_temp

  cpu_temp = 0
  temperature =0
  humidity = 0
  pressure = 0
Next, we read the temperature, pressure and humidity values using the corresponding functions, storing them in the appropriate variable and round the numbers.
temperature = sense.get_temperature()
  humidity = sense.get_humidity()+16.5
  pressure = sense.get_pressure()+20

  if pressure == 20 :
    pressure = sense.get_pressure()+20

  humidity = round(humidity,1)
  pressure = round(pressure,1)
Next, we create the readCPUTemperature function.
This function reads the CPU temperature of Raspberry pi and subtracts it from the temperature readings from the Sensehat sensor. This is done to improve the accuracy of the readings as the temperature from the Sensehat is usually affected by the temperature of the Raspberry Pi because it is directly mounted on it.
ef readCPUTemperature():

  global temperature

  cpu_temp = os.popen("/opt/vc/bin/vcgencmd measure_temp").read()
  cpu_temp = cpu_temp[:-3]
  cpu_temp = cpu_temp[5:]

  temperature = sense.get_temperature()

  print(cpu_temp)

  if cpu_temp == "42.9":
    temperature = temperature - 8.2
  elif cpu_temp == "44.0":
    temperature = temperature - 8.5
  elif cpu_temp == "44.5":
    temperature = temperature - 8.7
  elif cpu_temp == "45.1":
    temperature = temperature - 9.0
  elif cpu_temp == "46.7":
    temperature = temperature - 9.1
  elif cpu_temp == "47.2":
    temperature = temperature - 9.2
  elif cpu_temp == "47.8":
    temperature = temperature - 9.3
  elif cpu_temp == "48.3":
    temperature = temperature - 9.35
  elif cpu_temp == "48.9":
    temperature = temperature - 9.4
  else:
    temperature = temperature - 9.5
Next, we have the sendDataToServer() function.
This function uses threading to obtain the temperature, humidity and pressure data, displays it, and merges it with URL string to be sent to the server.
def sendDataToServer():
  global temperature
  global pressure
  global humidity

  threading.Timer(600,sendDataToServer).start()
  print("Sensing...")
  readSensor()
  readCPUTemperature()
  temperature = round(temperature,1)
  print(temperature)
  print(humidity)
  print(pressure)
        temp= "%.1f" %temperature
  hum ="%.1f" %humidity
  press = "%.1f" %pressure
  urllib2.urlopen("http://www.educ8s.tv/weather/add_data.php?temp="+temp+"&hum="+hum+"&pr="+press).read()
Lastly, the sendDataToServer function is called within the main code.
sendDataToServer()
The complete code for the Python script is available below and also attached under the download section.
import os
import threading
import urllib2
from sense_hat import SenseHat


sense = SenseHat()

def readSensor():

  global temperature
  global humidity
  global pressure
  global cpu_temp

  cpu_temp = 0
  temperature =0
  humidity = 0
  pressure = 0

  temperature = sense.get_temperature()
  humidity = sense.get_humidity()+16.5
  pressure = sense.get_pressure()+20

  if pressure == 20 :
    pressure = sense.get_pressure()+20

  humidity = round(humidity,1)
  pressure = round(pressure,1)

def readCPUTemperature():

  global temperature

  cpu_temp = os.popen("/opt/vc/bin/vcgencmd measure_temp").read()
  cpu_temp = cpu_temp[:-3]
  cpu_temp = cpu_temp[5:]

  temperature = sense.get_temperature()

  print(cpu_temp)

  if cpu_temp == "42.9":
    temperature = temperature - 8.2
  elif cpu_temp == "44.0":
    temperature = temperature - 8.5
  elif cpu_temp == "44.5":
    temperature = temperature - 8.7
  elif cpu_temp == "45.1":
    temperature = temperature - 9.0
  elif cpu_temp == "46.7":
    temperature = temperature - 9.1
  elif cpu_temp == "47.2":
    temperature = temperature - 9.2
  elif cpu_temp == "47.8":
    temperature = temperature - 9.3
  elif cpu_temp == "48.3":
    temperature = temperature - 9.35
  elif cpu_temp == "48.9":
    temperature = temperature - 9.4
  else:
    temperature = temperature - 9.5


def sendDataToServer():
  global temperature
  global pressure
  global humidity

  threading.Timer(600,sendDataToServer).start()
  print("Sensing...")
  readSensor()
  readCPUTemperature()
  temperature = round(temperature,1)
  print(temperature)
  print(humidity)
  print(pressure)
        temp= "%.1f" %temperature
  hum ="%.1f" %humidity
  press = "%.1f" %pressure
  urllib2.urlopen("http://www.educ8s.tv/weather/add_data.php?temp="+temp+"&hum="+hum+"&pr="+press).read()

sendDataToServer()
Demo
Power on your Pi. Log-in and open the python IDE. Copy the code and paste it in the python editor. By now, you should have uploaded the PHP files to your server and they should be ready to receive the data. As soon as that is confirmed, run the python script. After a while, you should see the data displaying in the table as shown in the image below.
This is essentially an IoT device and while all we measure for this tutorial is just temperature and humidity, the same procedure can be adopted for several other important applications like health monitoring, and utility management to mention some.
That’s it for this tutorial guys. What will you build? Do reach out to me via the comment section if you have any question.
The video version of this tutorial is available on youtube.
Till Next time.
can you please show what’s the structure of the database at mysql look like?
Hi. I am interested with this project. I just have one question, could you be able to display the temperature on a LCD monitor display?