RIAA Corrector
Description To listen old vinyl LP's in a correct sounding on a sassy with dynamic cartridge you need a circuit, named RIAA corrector. This circuit you can find in old amps, but it isn't embedded in home cinema equipments or amplifiers can be obtained nowadays.
Description
To listen old vinyl LP’s in a correct sounding on a sassy with dynamic cartridge you need a circuit, named RIAA corrector. This circuit you can find in old amps, but it isn’t embedded in home cinema equipments or amplifiers can be obtained nowadays. Also, if you want to archive your vinyl LP’s in your computer it is necessary to use this RIAA corrector. It is good, if this corrector has a little built-in amplifier to drive small control speakers, or earphones. Schematic of circuit built for this express purpose can be found hier. It has two parts, corrector and amplifier part.
The corrector part contains NE5532 integrated circuit with extreme small noise. Resistors are 1% metal film 0,6W types, condenser’s of this corrector section must be 5% or better, 63 – 100 V types. Corrector section has direct output to external amp or computer. Amplifier section contains integrated amp IC LM1877. It deliver to speakers 2W/channel output power with very low distortion. Potentiometer P1 is for control the output power of the amp section.
The whole circuit works from external 12-16 V DC supply. Schematic, photos and PCB layout of the circuitry can be found attached. Short mathematics description of RIAA curve and basics of LP’s production also can be found in attached document.
Schematic
Parts List
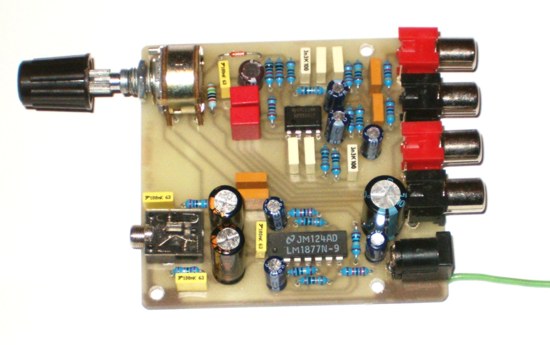
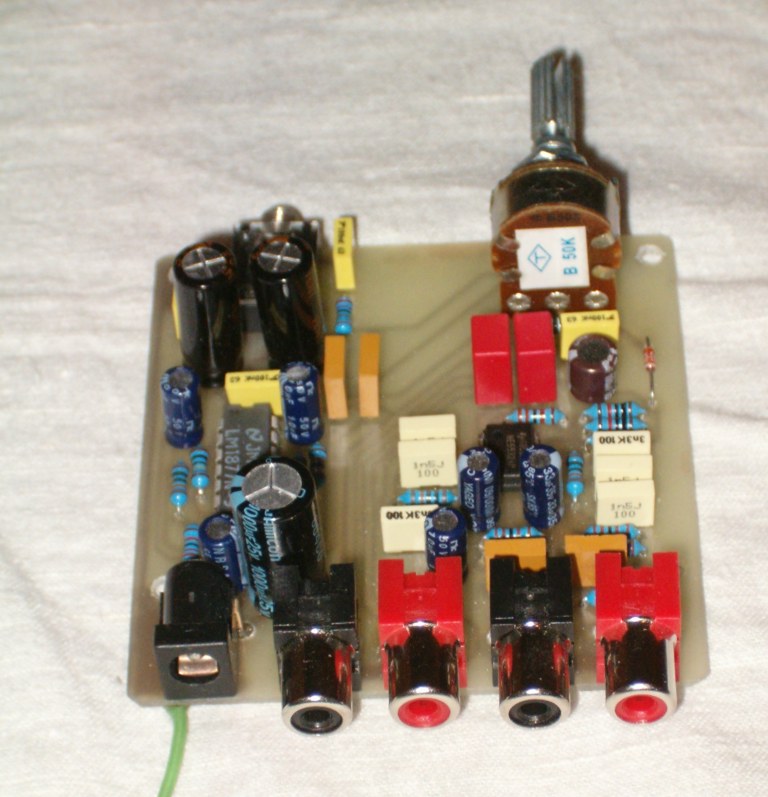
Photos
RIAA Curve
LP’s are engraved with reduced bass levels and increased treble levels.
For the same sound level, a low frequency requires a larger groove which gives two drawbacks:
– Less recording time
– Difficulties for the cartridge to follow it and thus, higher distortion
At the other end of the spectrum, the contact between the stylus and the groove makes noise, a high frequency noise. By increasing the high frequencies level during recording we can obtain a better signal/noise ratio as the noise is reduced by the playback curve.
Several other curves did exist before the RIAA but it replaced them completely during the 60′.
Here is the formula to obtain the original RIAA curve:
Where:
N=level in dB
f=frequency
t1=treble time constant, 75uS
t2=medium time constant, 318uS
t3=bass time constant, 3180uS
In 76′, IEC introduced a modification of this curve by introducing a new time constant that modifies only the extreme bass. It is known as the RIAA/IEC curve.
This correction has never obtained a big success, the original RIAA curve is still the most widely used.
For information, here is the formula:
Where: t4=extreme bass time constant, 7950uS
The RIAA reproduction curve:
![]()
| Hz | RIAA | IEC |
| 20 | 19.36 | 16.35 |
| 22 | 19.24 | 16.62 |
| 25 | 19.04 | 16.89 |
| 28 | 18.83 | 17.04 |
| 31 | 18.61 | 17.09 |
| 35 | 18.29 | 17.06 |
| 39 | 17.96 | 16.95 |
| 44 | 17.54 | 16.73 |
| 49 | 17.12 | 16.45 |
| 55 | 16.61 | 16.07 |
| 62 | 16.02 | 15.59 |
| 70 | 15.37 | 15.03 |
| 79 | 14.67 | 14.40 |
| 89 | 13.93 | 13.72 |
| 100 | 13.18 | 13.01 |
| 110 | 12.54 | 12.39 |
| 120 | 11.94 | 11.82 |
| 130 | 11.38 | 11.27 |
| 150 | 10.36 | 10.28 |
| 170 | 9.46 | 9.40 |
| 190 | 8.67 | 8.62 |
| 210 | 7.97 | 7.93 |
| 240 | 7.04 | 7.01 |
| 270 | 6.25 | 6.23 |
| 300 | 5.57 | 5.55 |
| 340 | 4.80 | 4.79 |
| 380 | 4.16 | 4.15 |
| 430 | 3.49 | 3.48 |
| 480 | 2.93 | 2.92 |
| 540 | 2.38 | 2.38 |
| 610 | 1.86 | 1.86 |
| 680 | 1.43 | 1.43 |
| 760 | 1.02 | 1.02 |
| 850 | 0.63 | 0.63 |
| 950 | 0.26 | 0.26 |
| 1100 | -0.23 | -0.23 |
| 1200 | -0.52 | -0.52 |
| 1300 | -0.79 | -0.79 |
| 1500 | -1.31 | -1.31 |
| 1700 | -1.80 | -1.80 |
| 1900 | -2.27 | -2.27 |
| 2100 | -2.73 | -2.73 |
| 2400 | -3.39 | -3.39 |
| 2700 | -4.04 | -4.04 |
| 3000 | -4.65 | -4.65 |
| 3400 | -5.43 | -5.43 |
| 3800 | -6.17 | -6.17 |
| 4300 | -7.02 | -7.02 |
| 4800 | -7.82 | -7.82 |
| 5400 | -8.70 | -8.70 |
| 6100 | -9.64 | -9.64 |
| 6800 | -10.50 | -10.50 |
| 7600 | -11.39 | -11.39 |
| 8500 | -12.30 | -12.30 |
| 9500 | -13.22 | -13.22 |
| 11000 | -14.44 | -14.44 |
| 12000 | -15.17 | -15.17 |
| 13000 | -15.85 | -15.85 |
| 15000 | -17.07 | -17.07 |
| 17000 | -18.14 | -18.14 |
| 19000 | -19.09 | -19.09 |
| 21000 | -19.95 | -19.95 |
Hey, i have only one question: I wanted to make the pcb but the pdf is not in its original size. how mutch dpi should i use to reproduce the correct size?
You are right. PCB seems oversized, so i suggest to try some prints on different scaling and when the IC fits on the footprint then you have found the correct scaling. Hope this tip helps.
Hello
in the equations given by you is a mistake … the data in the table are ok, but the equations are wrong