ESP8266 based Online Weather Widget using Wemos D1
A few years back I wrote this tutorial on connected weather monitor with plans of creating a 3D printed enclosure to make it portable and easy to use. I never got around doing that but a few days ago, I came across a similar project built by BitsandBlobs, which went as far as creating the 3D enclosure and I thought their example will be a fun way of sharing the project.
A few years back I wrote this tutorial on connected weather monitor with plans of creating a 3D printed enclosure to make it portable and easy to use. I never got around doing that but a few days ago, I came across a similar project built by BitsandBlobs, which went as far as creating the 3D enclosure and I thought their example will be a fun way of sharing the project. So for today’s tutorial, we will build a Connected Weather Widget.
Having an idea of what the current weather conditions are, or what it will look like in a couple of hours or days, has proven to be very useful, not just when it ensures you don’t get caught in the rain without your coat, but also for different important scenarios across different industries like Agriculture, Advertising, Transportation and even Warfare.
While one could build a weather monitoring station to get weather information about a particular place, there are scenarios where you want to obtain weather information about places where you do not have a station. For these scenarios, people usually turn to the news or their phone, but with everyone trying to reduce the amount of time spends with their phone, maybe it will be a good idea to have a device which provides you the weather information without the usual temptation to check your APP feed. This is what we are going to build today.
The project uses the WiFi features of the Wemos D1 mini to connect to an online open-source weather monitoring platform called OpenWeatherMap, where it obtains the required weather information, sorts it and displays it on the OLED.
At the end of today’s tutorial, you would know how to interface an OLED with the Wemos D1 and also obtain weather information from” OpenWeatherMap”.
Required Components
The following components are required to build this project;
- Wemos D1 Mini
- 0.96″ I2C OLED Display
- Jumper Wires
- BreadBoard (Optional)
- 3.7v Lipo Battery (optional)
All components can be bought from the attached links. While the components are soldered together for this project, you can choose to implement the project on a breadboard or even take things further and provide a backup battery to power the device instead of a USB. This is why the optional components have been added to the list.
Schematics
The use of just two components makes the schematics for this project quite straight forward. The OLED communicates with host microcontroller over I2C, as such, all we need to do is to connect it to the I2C pins of the Wemos D1 as shown below:
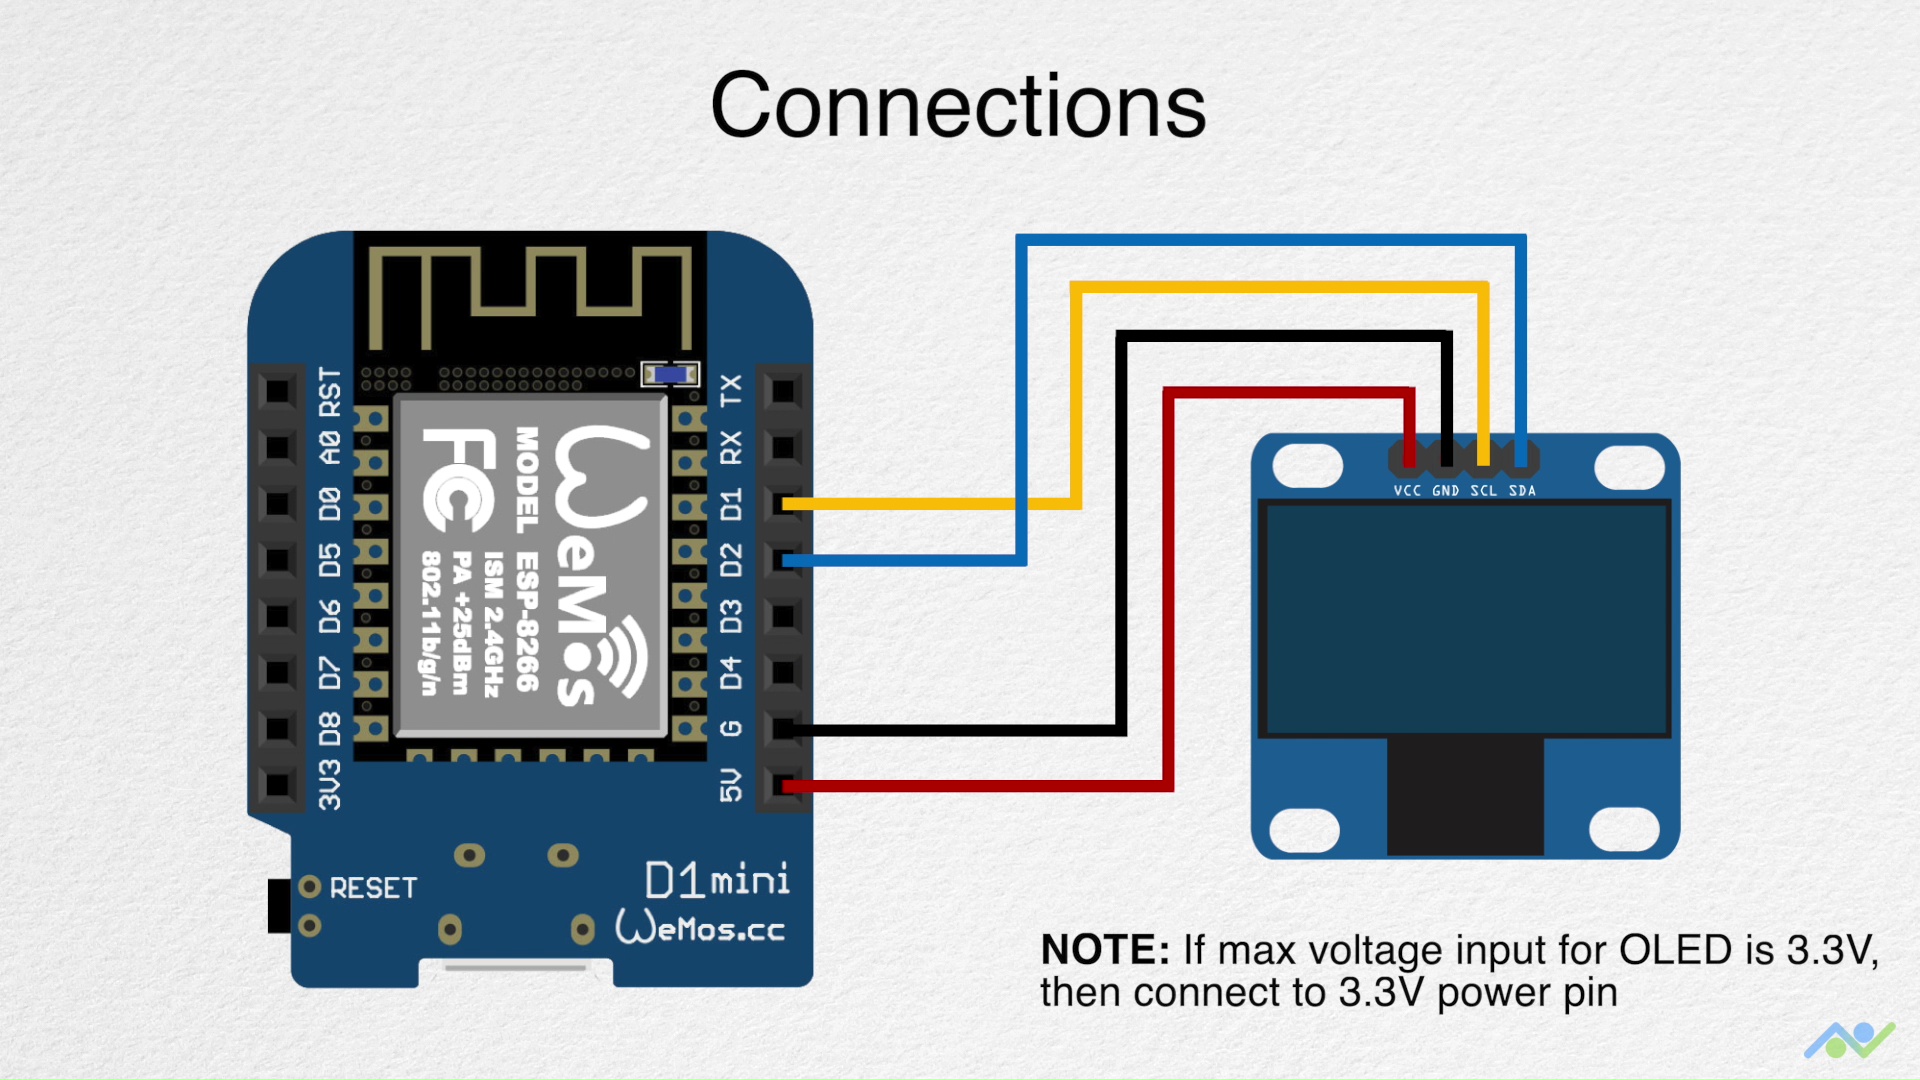
To make the schematics easier to follow, a pin-pin map showing how to components are connected is provided below:
OLED – Wemos D1 Mini
SCL - D1
SDA - D2
VCC - 5v
GND - GND
It is important to note the maximum input voltage of your OLED display and be sure it is 5V tolerant. You should connect the VCC pin of the OLED to the Wemos D1’s 3.3v pin if 5V is too high for the display.
Obtain OpenWeatherMap Credentials
As mentioned during the introduction, the weather information to be displayed on the OLED will be obtained from OpenWeatherMap, as such, before we proceed to write the code for this project, it is important to Signup and obtain the credentials, in this case, an API key, that will be used by our device to connect to the service.
To do this follow the steps below:
1. Point your web browser to OpenWeatherMaps Website and hit the “Sign up” button. If you already have an OpenWeatherMap account, just skip to the 3rd step.
2. Once the signup page opens, fill in all the necessary details and click on create an account. If successful, you will be automatically subscribed to the free OpenWeatherMap plan which will allow you to perform up to 60 API calls per minute among other perks. Since this is just a demo project, I believe this to be good enough but if you’d like more access, you can check out some of the other packages and subscribe to them if needed.
3. With registration complete, select the API Keys tab at the top of the resulting page. It should lead to a page with your API Key displayed as shown in the image below: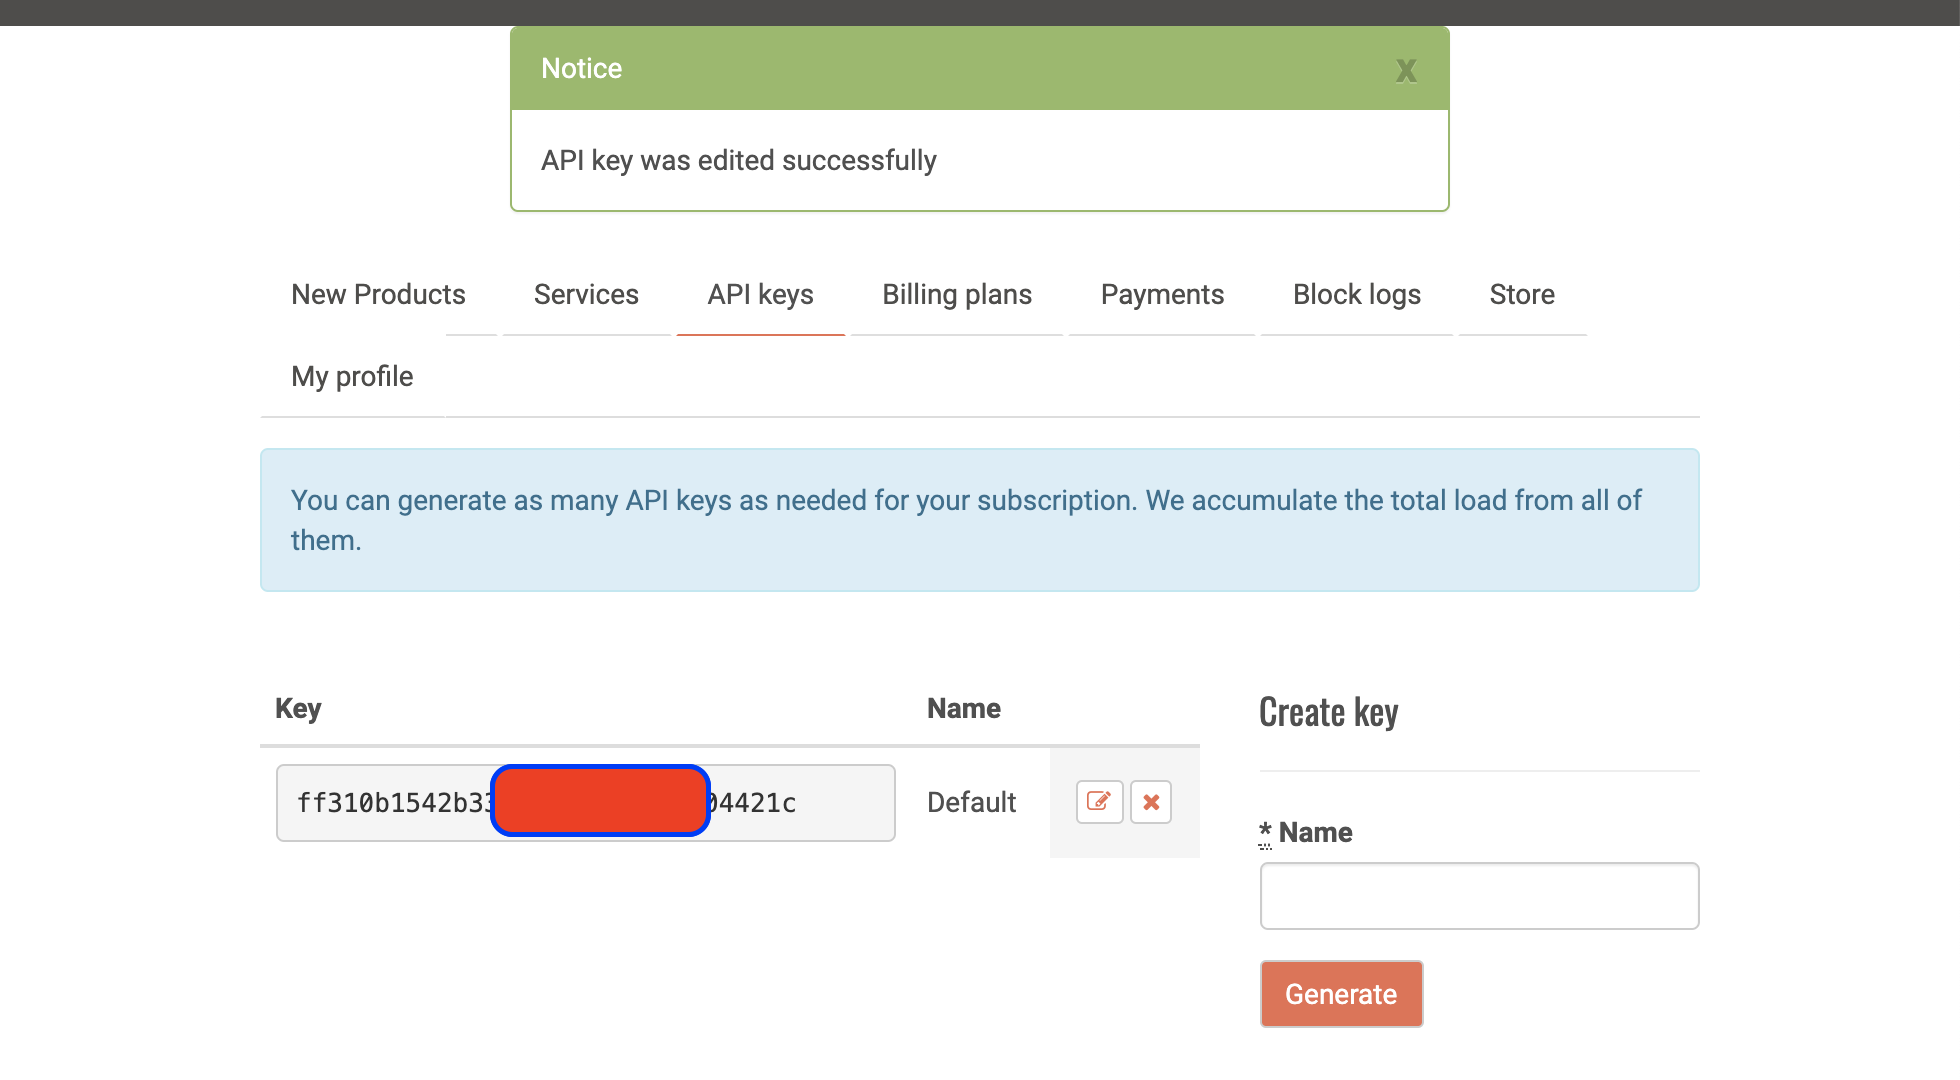
Copy the API key and paste in a notepad or any other safe place. We will need it for our code.
With this done successfully, we can proceed to write the code for the project.
Code
The Arduino IDE was used in developing the code for this project, as such, if this is the first time you are using an ESP8266 based board with the IDE, you will need to install the ESP8266 support for it. Follow this tutorial we wrote a while back on “Programming an ESP8266 Board with the Arduino IDE” to get it done.
The logic behind the code for the project is quite straight forward. We start by connecting the device to a WiFi access point through which it will access the OpenWeatherMaps server using the API key we obtained earlier. The response from OpenWeatherMap to the API call is parsed and the weather information contained is displayed on the OLED display.
The response from OpenWeatherMap is usually a JSON file, as such, to easily parse the data to obtain the information we need, we will use the Arduino Json Library which was created to help with creating or Parsing JSON files. We will also use the ESP8266 WIFI library, which will handle all network-related tasks, and the U8g2lib library to make interacting with the OLED seamless. All of the above libraries can be installed via the Arduino Library Manager or by downloading from the links attached to them and installing them manually.
As usual, I will do a quick run through the sketch and explain parts of it that I feel might be a little bit difficult to follow.
The sketch starts, as usual, with the inclusion of the libraries we will be using.
//Written  By Frenoy Osburn
// Modified by Emmanuel Odunlade

#include <ESP8266WiFi.h>
#include <stdio.h>
#include <ArduinoJson.h>
#include <U8g2lib.h>
Next, we create variables that are matched to different weather conditions with 0 representing the sun and 4 representing thunder.
#define SUN  0
#define SUN_CLOUD  1
#define CLOUD 2
#define RAIN 3
#define THUNDER 4
Next, we create an instance of the U8G2 library with the I2C pins of the Wemos D1 as arguments.
U8G2_SSD1306_128X64_NONAME_1_SW_I2C u8g2(U8G2_R0, /* clock=*/ SCL, /* data=*/ SDA, /* reset=*/ U8X8_PIN_NONE); // All Boards without Reset of the Display
Next, we supply the credentials of the WiFI access point through which the device will access the internet and create a few more variables to be used in tracking time within the code.
//initiate the WifiClient
WiFiClient client;

const char* ssid = "mySSID";
const char* password = "myPASSWORD";
unsigned long lastCallTime = 0;               // last time you called the updateWeather function, in milliseconds
const unsigned long postingInterval = 30L * 1000L;  // delay between updates, in milliseconds
Next, we create a variable to hold the API key we obtained earlier from OpenWeatherMap and the name of your city or the city whose weather report you are interested in. Do note the format in which the name of the city was written in my example and write yours the same way.
String APIKEY = "put your APIKEY here";
String NameOfCity = "put the name of the city you will like to get data for here" //e.g Lagos, NG if your city is Lagos in Nigeria.
With this done, we proceed to the void setup() function.
We start the function by initializing the OLED and creating a page which will serve as a splash screen for the device.
void setup()
{
  u8g2.begin();

  u8g2.firstPage();
  do {
    u8g2.setFont(u8g2_font_ncenB14_tr);
    u8g2.drawStr(0,20,"Online");
    u8g2.drawStr(28,40,"Weather");
    u8g2.drawStr(56,60,"Display");
  } while ( u8g2.nextPage() );
Next, we enable the display of UTF8 symbols on the display so it’s easy to do display things like degrees among others.
u8g2.enableUTF8Print(); //for the degree symbol
Next, we initialize the serial monitor for debugging purposes and kickstart wifi communications by connecting to the APN credentials we provided earlier.
Serial.begin(115200);
  Serial.println("\n\nOnline Weather Display\n");

  Serial.println("Connecting to network");
  WiFi.begin(ssid, password);

  int counter = 0;
  while (WiFi.status() != WL_CONNECTED)
  {
    delay(200);
    if (++counter > 100)
      ESP.restart();
    Serial.print( "." );
  }
  Serial.println("\nWiFi connected");
  printWifiStatus();
}
Next is the void loop() function.
The loop() function for this project simply calls the UpdateWeather function at certain intervals defined by the difference between when the last call was made and the current program run time.
void loop()
{
  if (millis() - lastCallTime > postingInterval)
  {
    updateWeather();
  }
}
Next, is the void updateWeather() function. The function, when called within the loop() function, connects to the OpenWeatherMap servers and uses the API key and the city name we provided go send a request for weather information to the server.
void updateWeather()
{
  // if there's a successful connection:
  if (client.connect("api.openweathermap.org", 80))
  {
    Serial.println("Connecting to OpenWeatherMap server...");
    // send the HTTP PUT request:
    client.println("GET /data/2.5/weather?q=" + NameOfCity + "&units=metric&APPID=" + APIKEY + "HTTP/1.1");
    client.println("Host: api.openweathermap.org");
    client.println("Connection: close");
    client.println();
If the server responds with the data, it is passed and each one is stored with a matching variable name.
// Check HTTP status
    char status[32] = {0};
    client.readBytesUntil('\r', status, sizeof(status));
    // It should be "HTTP/1.0 200 OK" or "HTTP/1.1 200 OK"
    if (strcmp(status + 9, "200 OK") != 0)
    {
      Serial.print(F("Unexpected response: "));
      Serial.println(status);
      return;
    }

    // Skip HTTP headers
    char endOfHeaders[] = "\r\n\r\n";
    if (!client.find(endOfHeaders))
    {
      Serial.println(F("Invalid response"));
      return;
    }

    // Allocate the JSON document
    // Use arduinojson.org/v6/assistant to compute the capacity.
    const size_t capacity = JSON_ARRAY_SIZE(1) + JSON_OBJECT_SIZE(1) + 2*JSON_OBJECT_SIZE(2) + JSON_OBJECT_SIZE(4) + 2*JSON_OBJECT_SIZE(5) + JSON_OBJECT_SIZE(13) + 270;
    DynamicJsonDocument doc(capacity);

    // Parse JSON object
    DeserializationError error = deserializeJson(doc, client);
    if (error) {
      Serial.print(F("deserializeJson() failed: "));
      Serial.println(error.c_str());
      return;
    }

    int weatherId = doc["weather"][0]["id"].as<int>();
    float weatherTemperature = doc["main"]["temp"].as<float>();
    int weatherHumidity = doc["main"]["humidity"].as<int>();
The response is displayed on the serial monitor and the corresponding weather status is printed on the OLED.
Serial.println(F("Response:"));
    Serial.print("Weather: ");
    Serial.println(weatherId);
    Serial.print("Temperature: ");
    Serial.println(weatherTemperature);
    Serial.print("Humidity: ");
    Serial.println(weatherHumidity);
    Serial.println();

    char scrollText[15];
    sprintf(scrollText, "Humidity:%3d%%", weatherHumidity);

    if(weatherId == 800)    //clear
    {
      draw(scrollText, SUN, weatherTemperature);
    }
    else
    {
      switch(weatherId/100)
      {
        case 2:     //Thunderstorm
            draw(scrollText, THUNDER, weatherTemperature);
            break;

        case 3:     //Drizzle
        case 5:     //Rain
            draw(scrollText, RAIN, weatherTemperature);
            break;

        case 7:     //Sun with clouds
            draw(scrollText, SUN_CLOUD, weatherTemperature);
            break;
        case 8:     //clouds
            draw(scrollText, CLOUD, weatherTemperature);
            break;

        default:    //Sun with clouds
            draw(scrollText, SUN_CLOUD, weatherTemperature);
            break;
      }
    }
  }
  else
  {
    // if you couldn't make a connection:
    Serial.println("connection failed");
  }

  // note the time that this function was called
   lastCallTime = millis();
}
The code contains a few more functions that are used in displaying the icons. It is quite self-explanatory and you should get the idea. You can also check out one of our past tutorials on “creating custom graphics for displays” to understand better.
The complete sketch is provided below:
//Written  By Frenoy Osburn
// Modified by Emmanuel Odunlade

#include <ESP8266WiFi.h>
#include <stdio.h>
#include <ArduinoJson.h>
#include <U8g2lib.h>

#define SUN  0
#define SUN_CLOUD  1
#define CLOUD 2
#define RAIN 3
#define THUNDER 4

U8G2_SSD1306_128X64_NONAME_1_SW_I2C u8g2(U8G2_R0, /* clock=*/ SCL, /* data=*/ SDA, /* reset=*/ U8X8_PIN_NONE);   // All Boards without Reset of the Display

//initiate the WifiClient
WiFiClient client;

const char* ssid = "mySSID";
const char* password = "myPASSWORD";

unsigned long lastCallTime = 0;               // last time you called the updateWeather function, in milliseconds
const unsigned long postingInterval = 30L * 1000L;  // delay between updates, in milliseconds

String APIKEY = "put your APIKEY here";
String NameOfCity = "put the name of the city you will like to get data for here" //e.g Lagos, NG if your city is Lagos in Nigeria.

void setup()
{
  u8g2.begin();

  u8g2.firstPage();
  do {
    u8g2.setFont(u8g2_font_ncenB14_tr);
    u8g2.drawStr(0,20,"Online");
    u8g2.drawStr(28,40,"Weather");
    u8g2.drawStr(56,60,"Display");
  } while ( u8g2.nextPage() );

  u8g2.enableUTF8Print();   //for the degree symbol

  Serial.begin(115200);
  Serial.println("\n\nOnline Weather Display\n");

  Serial.println("Connecting to network");
  WiFi.begin(ssid, password);

  int counter = 0;
  while (WiFi.status() != WL_CONNECTED)
  {
    delay(200);
    if (++counter > 100)
      ESP.restart();
    Serial.print( "." );
  }
  Serial.println("\nWiFi connected");
  printWifiStatus();
}

void loop()
{
  if (millis() - lastCallTime > postingInterval)
  {
    updateWeather();
  }
}

void updateWeather()
{
  // if there's a successful connection:
  if (client.connect("api.openweathermap.org", 80))
  {
    Serial.println("Connecting to OpenWeatherMap server...");
    // send the HTTP PUT request:
    client.println("GET /data/2.5/weather?q=" + NameOfCity + "&units=metric&APPID=" + APIKEY + "HTTP/1.1");
    client.println("Host: api.openweathermap.org");
    client.println("Connection: close");
    client.println();

    // Check HTTP status
    char status[32] = {0};
    client.readBytesUntil('\r', status, sizeof(status));
    // It should be "HTTP/1.0 200 OK" or "HTTP/1.1 200 OK"
    if (strcmp(status + 9, "200 OK") != 0)
    {
      Serial.print(F("Unexpected response: "));
      Serial.println(status);
      return;
    }

    // Skip HTTP headers
    char endOfHeaders[] = "\r\n\r\n";
    if (!client.find(endOfHeaders))
    {
      Serial.println(F("Invalid response"));
      return;
    }

    // Allocate the JSON document
    // Use arduinojson.org/v6/assistant to compute the capacity.
    const size_t capacity = JSON_ARRAY_SIZE(1) + JSON_OBJECT_SIZE(1) + 2*JSON_OBJECT_SIZE(2) + JSON_OBJECT_SIZE(4) + 2*JSON_OBJECT_SIZE(5) + JSON_OBJECT_SIZE(13) + 270;
    DynamicJsonDocument doc(capacity);

    // Parse JSON object
    DeserializationError error = deserializeJson(doc, client);
    if (error) {
      Serial.print(F("deserializeJson() failed: "));
      Serial.println(error.c_str());
      return;
    }

    int weatherId = doc["weather"][0]["id"].as<int>();
    float weatherTemperature = doc["main"]["temp"].as<float>();
    int weatherHumidity = doc["main"]["humidity"].as<int>();

    //Disconnect
    client.stop();

    Serial.println(F("Response:"));
    Serial.print("Weather: ");
    Serial.println(weatherId);
    Serial.print("Temperature: ");
    Serial.println(weatherTemperature);
    Serial.print("Humidity: ");
    Serial.println(weatherHumidity);
    Serial.println();

    char scrollText[15];
    sprintf(scrollText, "Humidity:%3d%%", weatherHumidity);

    if(weatherId == 800)    //clear
    {
      draw(scrollText, SUN, weatherTemperature);
    }
    else
    {
      switch(weatherId/100)
      {
        case 2:     //Thunderstorm
            draw(scrollText, THUNDER, weatherTemperature);
            break;

        case 3:     //Drizzle
        case 5:     //Rain
            draw(scrollText, RAIN, weatherTemperature);
            break;

        case 7:     //Sun with clouds
            draw(scrollText, SUN_CLOUD, weatherTemperature);
            break;
        case 8:     //clouds
            draw(scrollText, CLOUD, weatherTemperature);
            break;

        default:    //Sun with clouds
            draw(scrollText, SUN_CLOUD, weatherTemperature);
            break;
      }
    }
  }
  else
  {
    // if you couldn't make a connection:
    Serial.println("connection failed");
  }

  // note the time that this function was called
   lastCallTime = millis();
}

void printWifiStatus()
{
  // print the SSID of the network you're attached to:
  Serial.print("SSID: ");
  Serial.println(WiFi.SSID());

  // print your board's IP address:
  IPAddress ip = WiFi.localIP();
  Serial.print("IP Address: ");
  Serial.println(ip);

  // print the received signal strength:
  long rssi = WiFi.RSSI();
  Serial.print("signal strength (RSSI):");
  Serial.print(rssi);
  Serial.println(" dBm");
}

void drawWeatherSymbol(u8g2_uint_t x, u8g2_uint_t y, uint8_t symbol)
{
  // fonts used:
  // u8g2_font_open_iconic_embedded_6x_t
  // u8g2_font_open_iconic_weather_6x_t
  // encoding values, see: https://github.com/olikraus/u8g2/wiki/fntgrpiconic

  switch(symbol)
  {
    case SUN:
      u8g2.setFont(u8g2_font_open_iconic_weather_6x_t);
      u8g2.drawGlyph(x, y, 69);
      break;
    case SUN_CLOUD:
      u8g2.setFont(u8g2_font_open_iconic_weather_6x_t);
      u8g2.drawGlyph(x, y, 65);
      break;
    case CLOUD:
      u8g2.setFont(u8g2_font_open_iconic_weather_6x_t);
      u8g2.drawGlyph(x, y, 64);
      break;
    case RAIN:
      u8g2.setFont(u8g2_font_open_iconic_weather_6x_t);
      u8g2.drawGlyph(x, y, 67);
      break;
    case THUNDER:
      u8g2.setFont(u8g2_font_open_iconic_embedded_6x_t);
      u8g2.drawGlyph(x, y, 67);
      break;
  }
}

void drawWeather(uint8_t symbol, int degree)
{
  drawWeatherSymbol(0, 48, symbol);
  u8g2.setFont(u8g2_font_logisoso32_tf);
  u8g2.setCursor(48+3, 42);
  u8g2.print(degree);
  u8g2.print("°C");   // requires enableUTF8Print()
}

/*
  Draw a string with specified pixel offset.
  The offset can be negative.
  Limitation: The monochrome font with 8 pixel per glyph
*/
void drawScrollString(int16_t offset, const char *s)
{
  static char buf[36];  // should for screen with up to 256 pixel width
  size_t len;
  size_t char_offset = 0;
  u8g2_uint_t dx = 0;
  size_t visible = 0;
  len = strlen(s);
  if ( offset < 0 )
  {
    char_offset = (-offset)/8;
    dx = offset + char_offset*8;
    if ( char_offset >= u8g2.getDisplayWidth()/8 )
      return;
    visible = u8g2.getDisplayWidth()/8-char_offset+1;
    strncpy(buf, s, visible);
    buf[visible] = '\0';
    u8g2.setFont(u8g2_font_8x13_mf);
    u8g2.drawStr(char_offset*8-dx, 62, buf);
  }
  else
  {
    char_offset = offset / 8;
    if ( char_offset >= len )
      return; // nothing visible
    dx = offset - char_offset*8;
    visible = len - char_offset;
    if ( visible > u8g2.getDisplayWidth()/8+1 )
      visible = u8g2.getDisplayWidth()/8+1;
    strncpy(buf, s+char_offset, visible);
    buf[visible] = '\0';
    u8g2.setFont(u8g2_font_8x13_mf);
    u8g2.drawStr(-dx, 62, buf);
  }
}

void draw(const char *s, uint8_t symbol, int degree)
{
  int16_t offset = -(int16_t)u8g2.getDisplayWidth();
  int16_t len = strlen(s);
  for(;;)
  {
    u8g2.firstPage();
    do {
      drawWeather(symbol, degree);
      drawScrollString(offset, s);
    } while ( u8g2.nextPage() );
    delay(20);
    offset+=2;
    if ( offset > len*8+1 )
      break;
  }
}
Demo
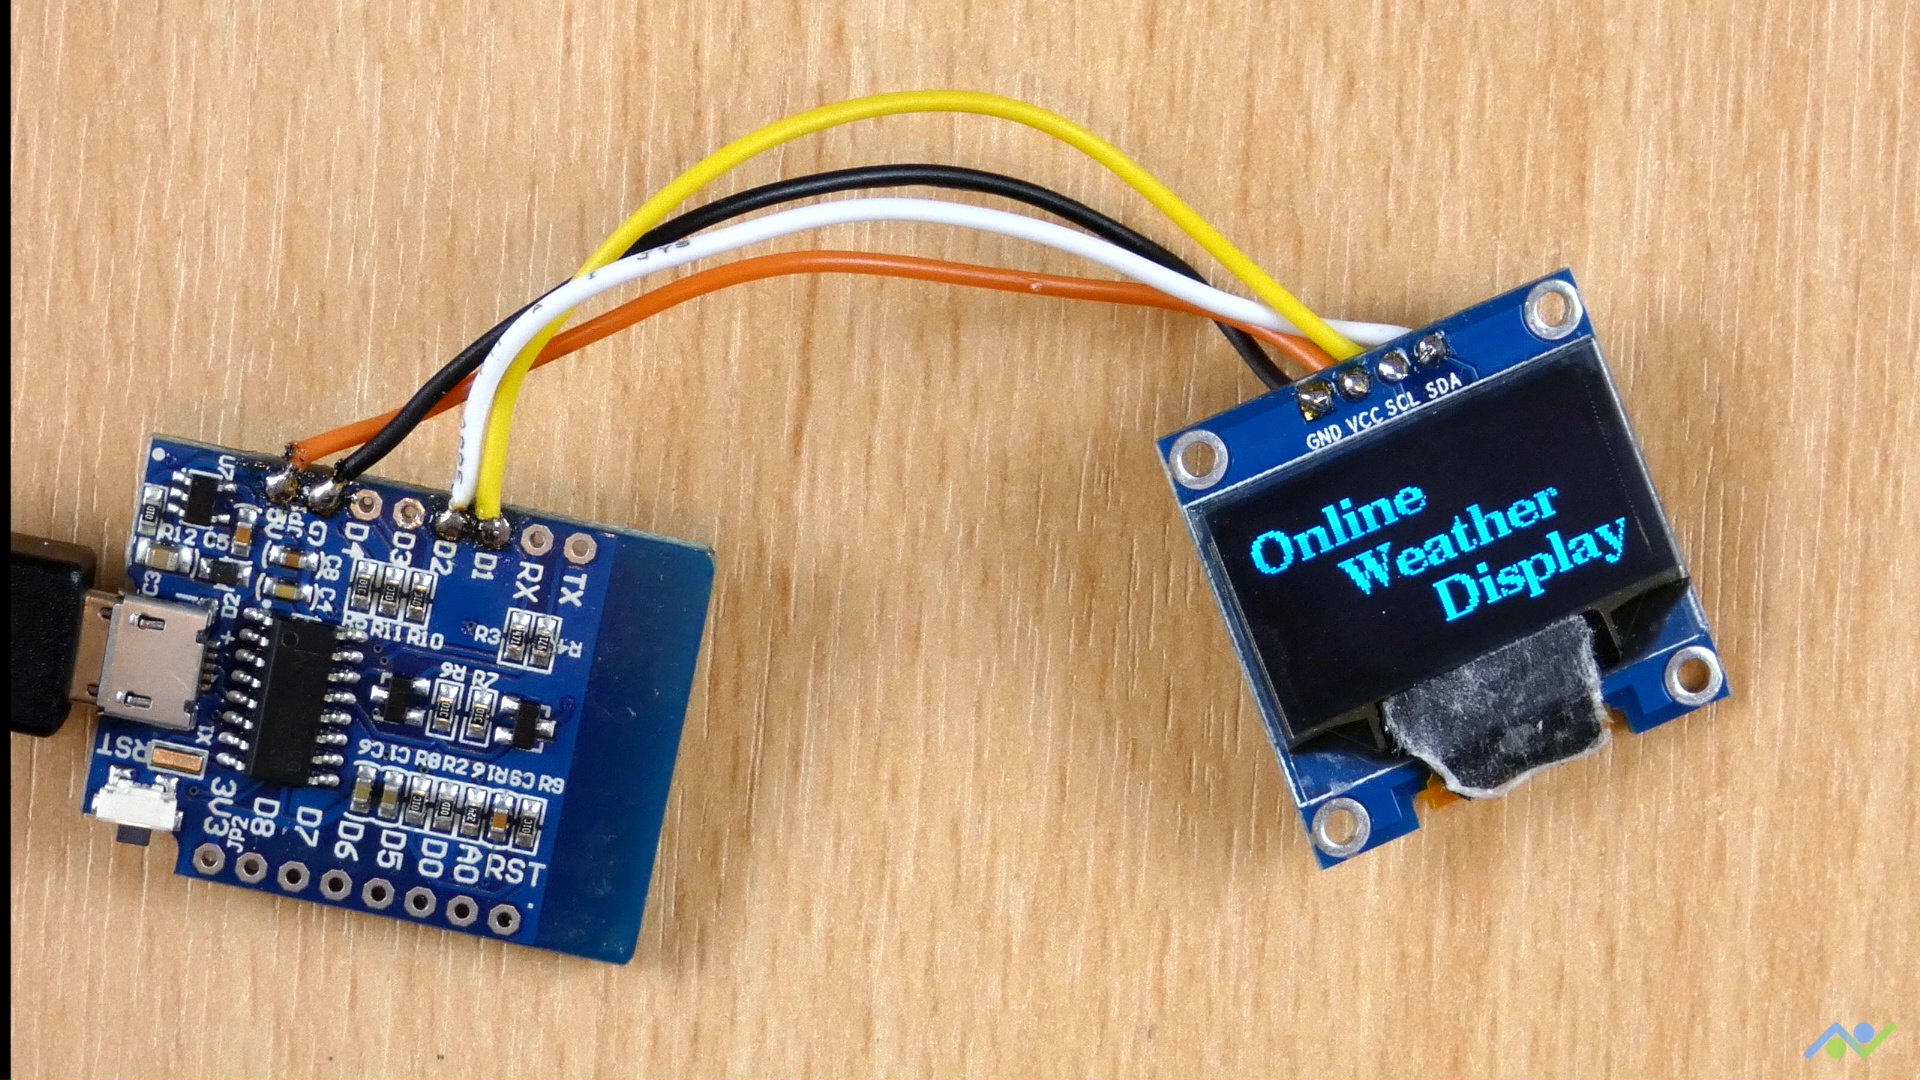
Go over the connections again and ensure you have the ESP8266’s Arduino IDE board support package installed along with the U8g2 library. Once confirmed, connect the Wemos D1 to your computer and select it in the Arduino IDE along with the port to which it is connected. Hit the upload button and wait for the completion of the upload process. When completed, you should see the weather information displayed on the OLED as shown in the image below.
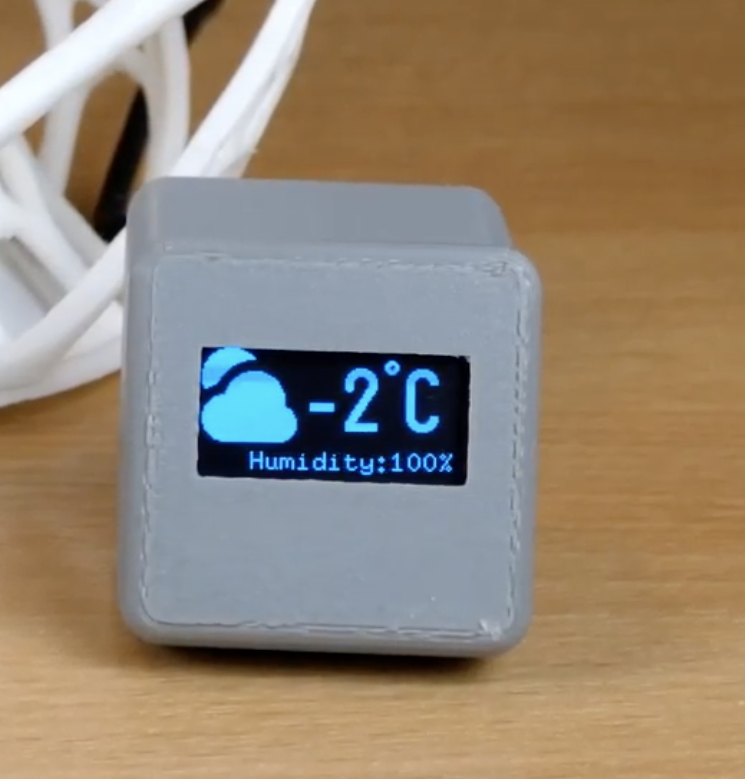
To take things further, a nice improvement BitsandBlobs made compared to my own project was the creation of a 3D printed enclosure to house the device. It makes the project look really nice and presentable, and it’s one of the reasons why I decided to share it here. The design and assembly instructions of the enclosure are available on Thingiverse, so all you need to do is to download and print it. After putting it in the 3D printed enclosure, the device should look like the image below.
That’s it for this tutorial, thanks for reading. Do let me know via the comment section if you built one of these and also let me know if you have any challenges replicating them.
I just keep getting error 401 back from the API call.. I checked 3x to make sure I had right API Key?
Same issue, error 401. Tried multiple api keys. Any suggestions?
I am also getting the same error 401. Something in the code is amiss. Please help!
There is a problem at the end of the line because you have to add space betwenn “APIKEY” and “HTTP”, the final line will be like this:
client.println(“GET /data/2.5/weather?q=” + NameOfCity + “&units=metric&appid=” + APIKEY + ” HTTP/1.1″);