UDE 2026 Adds CPU Profiling, Python Debugger, and Expanded MCU Support
PLS announced the latest upgrade to its Universal Debug Engine, featuring sampling-based CPU profiling, an integrated Python debugger, expanded AUTOSAR visualization, and support for new MCU families.
PLS Programmierbare Logik & Systeme has announced the release of Universal Debug Engine (UDE) 2026, introducing several workflow improvements for embedded systems developers working with microcontrollers and processors. The update will be unveiled at Embedded World 2026 and focuses on enhanced debugging capabilities, expanded trace analysis, and broader device support.
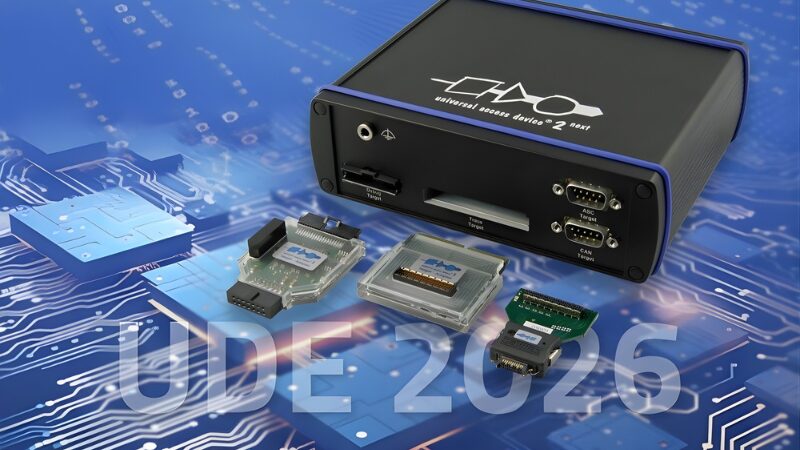
PLS’ UDE 2026 release aims to speed up and simplify debugging, tracing, and testing on microcontrollers and processors. Image used courtesy of PLS Programmierbare Logik & Systeme
Sampling-Based CPU Utilization Analysis
One of the more practical additions in UDE 2026 is the expansion of CPU utilization profiling to include sampling via the debug interface. Previously, this functionality relied exclusively on dedicated trace hardware within the target MCU. The sampling method trades some statistical precision for compatibility with microcontrollers that lack integrated trace systems. This change extends runtime analysis capabilities to a wider range of devices, particularly useful for developers working with cost-sensitive designs or legacy architectures.
The update also improves support for AUTOSAR-based applications through additional operating system hooks defined in the AUTOSAR Runtime Interfaces. These hooks enable visualization of service calls and spinlocks alongside tasks and interrupts in the execution sequence chart, providing more granular insight into application and operating system behavior during development.
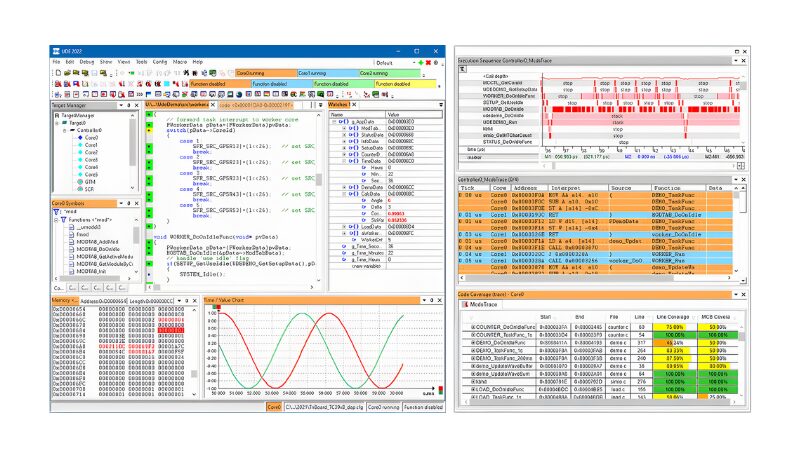
A look inside UDE’s earlier user interface. Image used courtesy of PLS Programmierbare Logik & Systeme
Integrated Python Script Debugging
UDE 2026 includes a Python script debugger within its integrated console, addressing a common need for developers who automate testing and debugging workflows. The debugger supports standard features, including breakpoints, single-stepping through code, and variable inspection via a dedicated watch window. This integration streamlines the development of automation scripts without requiring external tools.
Device-Specific Enhancements
The UDE release includes targeted improvements for specific MCU families. For Infineon’s AURIX TC4Dx devices, trace support now extends to virtualized applications managed by the hardware hypervisor, making virtual machines visible in trace records. Additionally, trace functionality has been enabled for production devices, allowing engineers to capture trace data both during development with emulation hardware and in field deployments with standard MCUs. However, production device tracing is limited by reduced trace memory and supports only single recordings per reset cycle.
For TTControl TTC 2300 and TTC 2030 series control units based on AURIX TC3xx, PLS has provided preconfigured target configurations that eliminate the need for ECU-specific setup, reducing initial configuration time for developers.

PLS’ Universal Access Device 2pro for microcontroller debugging. Image used courtesy of PLS Programmierbare Logik & Systeme
Expanded Architecture Support
UDE 2026 adds support for several new device families across multiple architectures. Arm Cortex-based additions include NXP’s S32K5 automotive MCUs, STMicroelectronics’ STM32H5 series, Texas Instruments’ MSPM0 and MSPM33 mixed-signal controllers, the latest Infineon MOTIX family devices, and Tongxin Micro’s THA6 Gen2 automotive MCUs. On the RISC-V side, the tool now supports the AndesStar V5 32-bit architecture, with initial deployments on the AndesCore D23 processor.
UDE 2026 is scheduled for general availability in early May 2026. The update represents a measured expansion of the platform’s capabilities, focusing on accessibility improvements and support for current-generation microcontrollers. These enhancements should be useful to embedded developers working on automotive systems, industrial controls, and other applications that require detailed runtime analysis and multi-core debugging.


