Debugging Pico using SWD and UART with the new Raspberry Pi Debug Probe, at just $12
The Raspberry Pi Debug Probe is a comprehensive USB-to-debug kit that provides the necessary hardware for solderless, plug-and-play debugging. It is inspired by the trend where electronics enthusiasts used one Raspberry Pi Pico to debug programs running on another Pico board and features Raspberry Pi's RP2040, a dual-core Arm Cortex-M0+ microcontroller with clever Programmable Input/Output (PIO) blocks.
The Raspberry Pi Debug Probe is a comprehensive USB-to-debug kit that provides the necessary hardware for solderless, plug-and-play debugging. It is inspired by the trend where electronics enthusiasts used one Raspberry Pi Pico to debug programs running on another Pico board and features Raspberry Pi’s RP2040, a dual-core Arm Cortex-M0+ microcontroller with clever Programmable Input/Output (PIO) blocks.
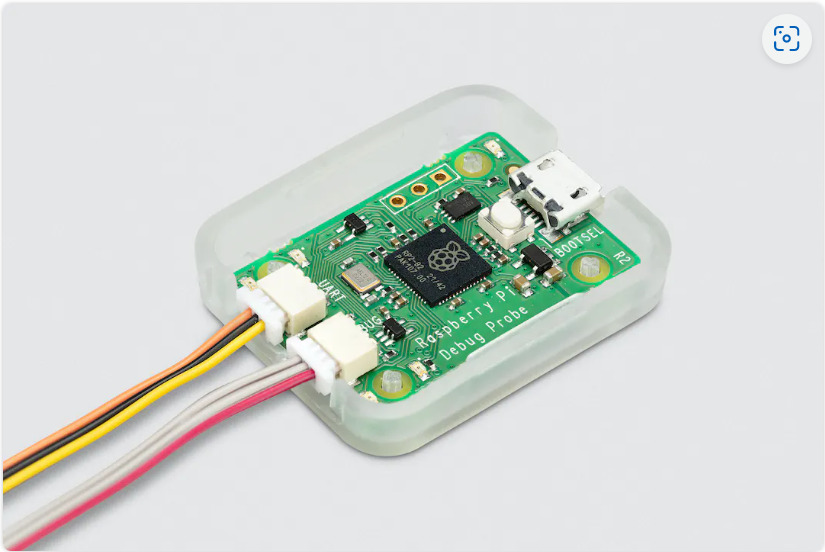
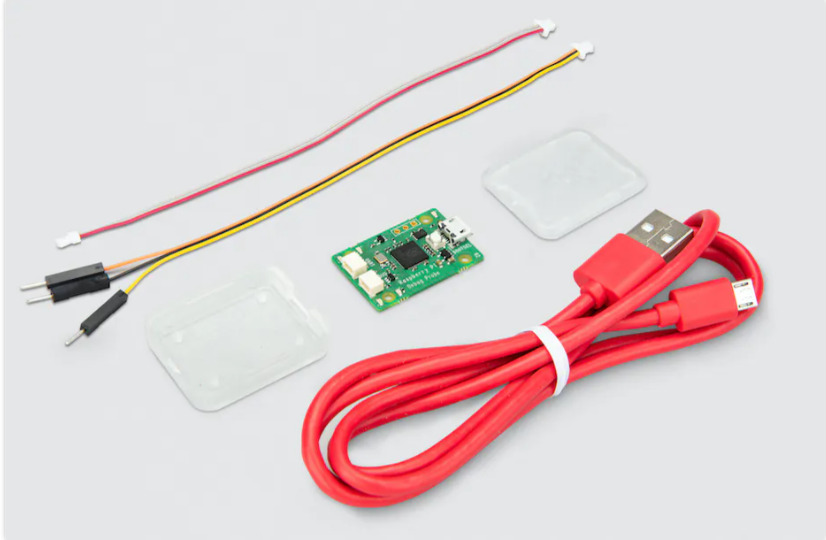
The Raspberry Pi Debug Probe is a compact board that provides a micro-USB connection at one end and headers for UART serial and SWD debugging at the other – plus an unpopulated three-pin header to access SWD on its RP2040 if required. To cover the vast majority of debugging use cases, the Raspberry Pi Debug Probe is a kit comprising the Pico Debug Probe hardware in a dedicated plastic case together with a USB cable and three types of debug cable:
- USB cable
- Three debug cables
- 3-pin JST connector to 3-pin JST connector cable
- 3-pin JST connector to 0.1-inch header (female)
- 3-pin JST connector to 0.1-inch header (male)
It is designed to simplify debugging and programming on Raspberry Pi Pico and RP2040 with a range of host platforms, including Windows, Mac, and Linux, despite the GPIO header’s unavailability to connect directly to the Pico’s serial UART or SWD port.
Debugging: Why and How
Debugging is an essential aspect of software development. It can help to identify and fix issues in a timely and efficient manner. Some everyday use cases for debugging in the Raspberry Pi Pico include:
- Code optimization: Debugging can help identify performance bottlenecks that could be optimized to improve the overall efficiency and speed of the system.
- Troubleshooting: Debugging can help identify and isolate issues with the code or hardware. It can be handy when developing complex systems that involve multiple components.
- Testing: Debugging ensures that the code works as expected and the system functions correctly. It is crucial in safety-critical applications.
- Integration: Debugging can help to identify and resolve issues that may arise when integrating third-party libraries or components into the system.
To support debugging, the Raspberry Pi Pico includes a built-in USB port that can be used for programming and debugging. It also supports a range of software development tools, including the C/C++ compiler and IDEs like Visual Studio Code, to write, compile, and debug code for the Pico. Additionally, the Pico includes a built-in LED that can be used for status indicators and debugging purposes.
Debugging the Raspberry Pi Pico can be done using various methods and tools, depending on your preferred development environment and programming language.
One common approach to debugging the Pico is printf-style debugging by printing data to the console for diagnosis. Raspberry Pi Pico has a UART interface to send and receive data over a serial connection. You can use a USB-to-serial adapter to connect the Pico to your computer and view the output in a terminal program like PuTTY.
Another approach is to use a hardware debugger, such as the Pico Debug Probe to connect to the Pico’s SWD interface and perform complex debugging tasks like setting breakpoints, single-stepping through code, and examining memory and register values. To use a hardware debugger, you’ll need to connect the debugger to the Pico’s SWD interface, which is available on the board’s GPIO header.
In the case of MicroPython or CircuitPython on the Pico, the built-in REPL (Read-Evaluate-Print Loop) can be used to interact with the board and diagnose issues in real time.
Finally, many IDEs also offer built-in debugging tools for Raspberry Pi Pico, including VS Code, Arduino IDE, and Raspberry Pi Pico C/C++ SDK. These tools can provide a streamlined debugging experience with features like code stepping, variable inspection, and conditional breakpoints.
Raspberry Pi Debug Probe
The Pico Debug Probe contains all the hardware required for debugging the Pico code in various methods listed above. The Raspberry Pi Debug Probe exposes the SWD signals on a three-pin JST connector, conforming to the Raspberry Pi Debug Connector Specification. The Debug Probe also provides adapter cables to connect to the debug connector on Raspberry Pi Pico and Pico W without soldering to the breadboard. The Raspberry Pi Debug Probe also functions as a USB serial adapter over the same USB connection as the SWD bridge. It exposes the UART signals on a second three-pin JST connector.
According to Raspberry Pi, the board is primarily designed to be used with Raspberry Pi Pico and Pico W. Nevertheless, it is also compatible with any Arm-based microcontroller which supports SWD and operates at 3.3V logic.
The Debug Probe is based on Raspberry Pi Pico hardware. It runs the open-source Raspberry Pi Picoprobe software, which allows a Pico and RP2040 to be used as USB to SWD and UART bridge. In addition, Raspberry Pi Pico or Pico W can be coupled with Picoprobe firmware to convert it into a device functionally equivalent to the Raspberry Pi Debug Probe, only lacking in the handy JST connectors.
The form factor of Pico Debug Probe is 22mm X 32mm, with features like USB to two-wire serial debug bridge, USB to UART bridge and follows the Raspberry Pi 3-pin Debug connector specification. Its nominal I/O voltage is 3.3V with operating temperature at -20C to 70C.
To know more about the product, please visit Buy a Raspberry Pi Debug Probe – Raspberry Pi