DIY Spectrum Analyser
Alan X has been working on a spectrum analyser project that can show the spectrum visually! He started working with ATTiny85 and kept on updating the project over time.
Alan X has been working on a spectrum analyser project that can show the spectrum visually! He started working with ATTiny85 and kept on updating the project over time.
Alan X used Goertzel’s algorithm with a Hamming window, this algorithm can be used to detect a frequency from sampled data. Here is the preliminary code for a spectrum analyzer:
#include <stdio.h>
#include <stdlib.h>
#include <math.h>
// Uses Daniil Guitelson's BGI library
#include "graphics.h" // -lBGI -lgdi32


#define SampleFreq 125000


int main(void)
{
  int N=250;
  double data[N];
  double samples[N];
  double freq;
  double s;
  double s_prev;
  double s_prev2;
  double coeff;
  double magn;
  int i;


  int gd=CUSTOM, gm=CUSTOM_MODE(700,700);
  initgraph(&gd, &gm, "");
  setcolor(WHITE);


  int X1,Y1,X2,Y2;
  double scale,xmin,ymin,xmax,ymax;


  // Find the maximum and minimum data range
  xmin=0;
  ymin=0;
  xmax=50000;
  ymax=N;
  scale=1.1*(xmax-xmin>ymax-ymin?xmax-xmin:ymax-ymin);


  // Generate samples
  for (i=0;i<N;i++) {
    samples[i]=(50*sin(2*M_PI*i*3300/SampleFreq)+50*sin(2*M_PI*i*5700/SampleFreq)+50*sin(2*M_PI*i*25700/SampleFreq)+100);
    // Window the data
    // data[i]=samples[i]; // Straight Goertzel - not great
    // data[i]=samples[i]*(0.5-0.25*cos(2*M_PI*i/N)); // Hanning Window
    data[i]=samples[i]*(0.54-0.46*cos(2*M_PI*i/N)); // Hamming Window
    // data[i]=samples[i]*(0.426551-0.496561*cos(2*M_PI*i/N)+0.076848*cos(4*M_PI*i/N)); // Exact Blackman Window
  }


  // Scan frequencies
  for (freq=100;freq<=50000;freq+=100) {
    coeff=2*cos(2*M_PI*freq/SampleFreq);
    s_prev=0.0;
    s_prev2=0.0;
    for (i=0;i<N;i++) {
      // Goertzel
      s=data[i]+coeff*s_prev-s_prev2;
      s_prev2=s_prev;
      s_prev=s;


    }


    // Get magnitude
    magn=2*sqrt(s_prev2*s_prev2+s_prev*s_prev-coeff*s_prev*s_prev2)/N;
    printf("Freq: %6f Mag: %6.4f\n",freq,magn);


    // Plot data
    X1=(int)((freq-(xmin+xmax)/2)*700/scale+350);
    Y1=(int)((0+(ymin+ymax)/2)*700/scale+650);
    X2=(int)((freq-(xmin+xmax)/2)*700/scale+350);
    Y2=(int)((-magn*700/2+(ymin+ymax)/2)*700/scale+650);
    line(X1,Y1,X2,Y2);


  }
  getchar();
  closegraph();


  return 0;
}
Daniil Guitelson’s BGI library was also used for the graphics.
Output
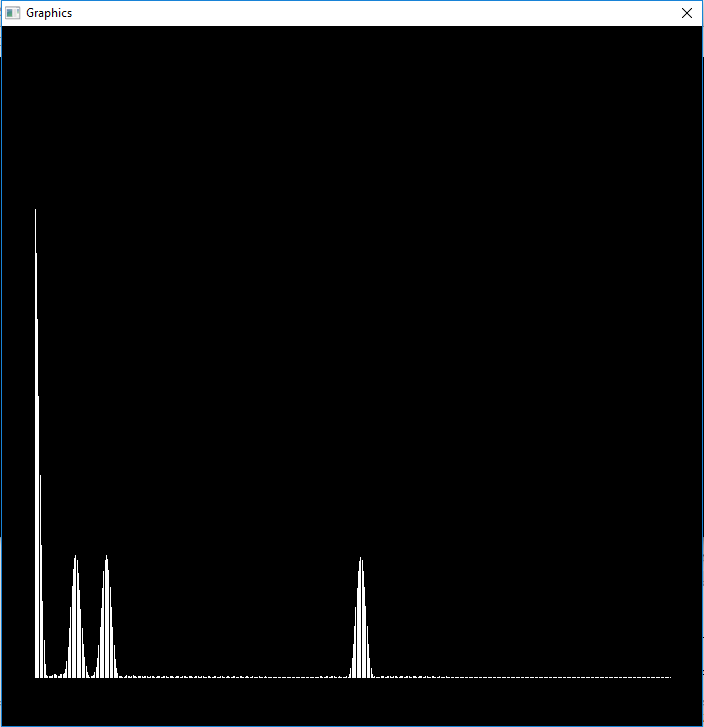
Here is the output showing the DC, 3300 Hz, 5700 Hz and 25700 Hz signals:
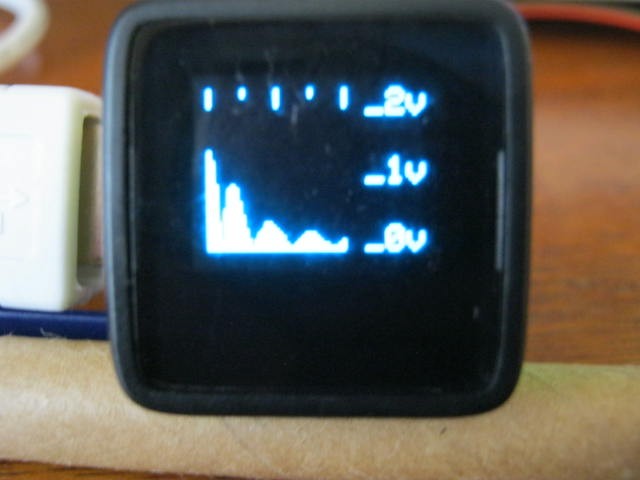
The next step is to port the code to a suitable Arduino board and to show the results physically. Thus, he used a MicroView OLED display and here it is listening to a 3v 1kHz square wave:
#include <MicroView.h>

// Audio Spectrum Analyser
#define SampleInput A0   // Name the sample input pin
#define BandWidth  500   // BandWidth
#define MaxFreq   4000   // Max analysis frequency
#define Trigger     10   // Trigger to synchronise the sampler 2vpp at 1kHz = 32

// Define various ADC prescaler
const unsigned char PS_16=(1<<ADPS2);
const unsigned char PS_32=(1<<ADPS2)|(1<<ADPS0);
const unsigned char PS_64=(1<<ADPS2)|(1<<ADPS1);
const unsigned char PS_128=(1<<ADPS2)|(1<<ADPS1)|(1<<ADPS0);

// Setup the serial port and pin 2
void setup() {
// Setup the ADC
pinMode(SampleInput,INPUT);
ADCSRA&=~PS_128; // Remove bits set by Arduino library
// Set prescaler
// ADCSRA|=PS_64; // 64 prescaler (250 kHz assuming a 16MHz clock)
// ADCSRA|=PS_32; // 32 prescaler (500 kHz assuming a 16MHz clock)
ADCSRA|=PS_16; // 16 prescaler (1 MHz assuming a 16MHz clock)

uView.begin();// Start MicroView
uView.clear(PAGE); // Clear page
uView.println("Spectrum  Analyser"); // Project
uView.println("0-20 kHz"); // Range
uView.println();
uView.println("agp.cooper@gmail.com"); // Author
uView.display(); // Display
uView.clear(PAGE); // Clear page
delay(2000);// Wait
}

void loop() {
static byte *samples; // Sample array pointer
static byte *window; // Window array pointer
static int N=0; // Number of samples for BandWidth
static long sampleFreq; // Sample frequency
long freq; // Frequency of interest
float s; // Goertzel variables
float s_prev;
float s_prev2;
float coeff;
float magn;
int i;

if (N==0) {
// Check sample frequency and set number of samples
samples=(byte *)malloc(100);
unsigned long ts=micros();
for (i=0;i<100;i++) samples[i]=(byte)(analogRead(SampleInput)>>2);
unsigned long tf=micros();
free(samples);
sampleFreq=100000000/(tf-ts);
N=2*sampleFreq/BandWidth+1;

uView.setCursor(0,0); // Set cursor to beginning
uView.print("SI: A"); // Sample input pin
uView.println(SampleInput-14);
uView.print("SF: "); // Sample frequency
uView.println(sampleFreq);
uView.print("MF: "); // Max frequency
uView.println(MaxFreq);
uView.print("BW: ");// andWidth
uView.println(MaxFreq);
uView.print("SN: ");// Number of samples
uView.println(N);
uView.display(); // Display
uView.clear(PAGE);// Clear page
delay(2000);

// Create arrays
samples=(byte *)malloc(N);
window=(byte *)malloc(N);

// Modified Hamming Window
for (i=0;i<N;i++) window[i]=(byte)((0.54-0.46*cos(2*M_PI*i/(N-1)))*255);

// Generate test samples
for (i=0;i<N;i++) {
samples[i]=(byte)(30*(sin(2*M_PI*i*5000/sampleFreq)+sin(2*M_PI*i*2500/sampleFreq)+sin(2*M_PI*i*7500/sampleFreq)+sin(2*M_PI*i*10000/sampleFreq))+127);
}
}

if (true) {
// Sychronise the start of sampling with data slicer
int a0,a1;
a0=1023;
for (i=0;i<N;i+=2) {
a1=analogRead(SampleInput);
a0=(a0*13+a1*3)/16;
if (a1>a0+3) break;
}
for (i=0;i<N;i++) samples[i]=(byte)(analogRead(SampleInput)>>2);
}

// Scan frequencies
for (freq=0;freq<=MaxFreq;freq+=(MaxFreq/40)) {
// Goertzel (https://en.wikipedia.org/wiki/Goertzel_algorithm)
coeff=2*cos(2*M_PI*freq/sampleFreq);
s_prev=0;
s_prev2=0;
for (i=0;i<N;i++) {
s=0.0000768935*window[i]*samples[i]+s_prev*coeff-s_prev2;
s_prev2=s_prev;
s_prev=s;
}
// Get magnitude
magn=2*sqrt(s_prev2*s_prev2+s_prev*s_prev-coeff*s_prev*s_prev2)/N;
// Display on MicroView
uView.line(freq*40/MaxFreq,47,freq*40/MaxFreq,10-(int)(20*log10(magn+0.0001)));
}
// Frequency graduations
uView.setCursor(47,0);
uView.print(MaxFreq/1000);
uView.print("k");
uView.line(0,0,0,5);
uView.line(10,0,10,2);
uView.line(20,0,20,5);
uView.line(30,0,30,2);
uView.line(40,0,40,5);
// Voltage graduations
uView.line(0,40,40,40);
uView.setCursor(47,38);
uView.print("-30");
uView.line(0,20,40,20);
uView.setCursor(47,18);
uView.print("-10");
uView.line(0,10,40,10);
uView.setCursor(47,8);
uView.print("  0");
//Display
uView.display();
uView.clear(PAGE);
}
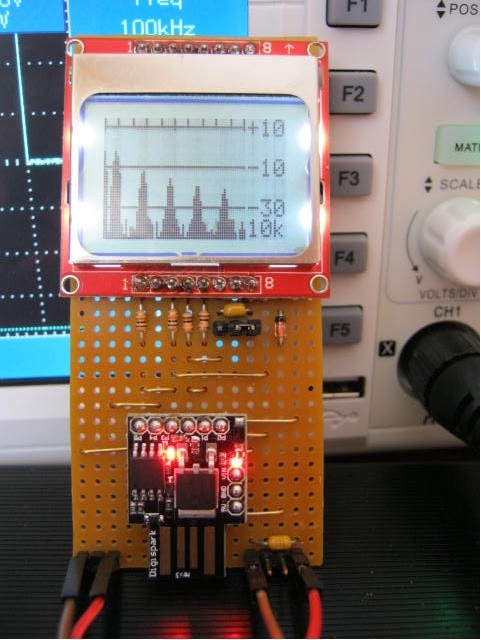
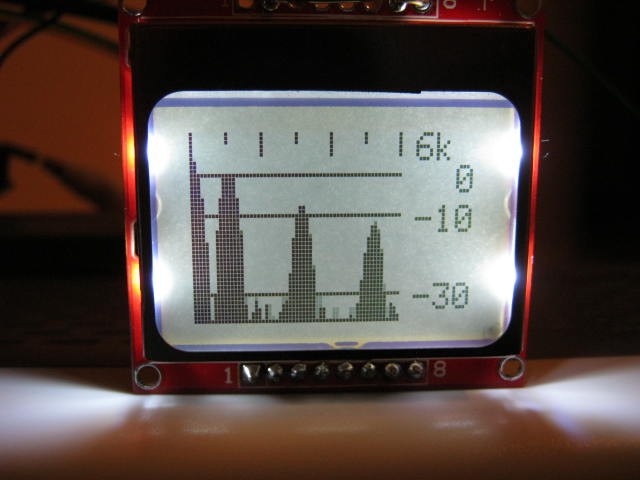
He then updated the project to work with Nokia LCD, here it is showing the 0-3v 1 kHz square wave signal:
Amazing ideas and projects can be inspired by this project. You can download these files to start your own spectrum analyser!
The full project and detailed information are available at the project page on Hackaday. You can follow it to keep updates with the latest versions.


